Currencies
EUR/USD – continued to drop as the EUR weakened due to weak German GDP data and the USD strengthened on the backdrop of some strong US data. US sales data was much better than expected, especially since last month’s data was revised upwards and posted solid gains as well as very strong NY Empire State Manufacturing Index which was the highest in nearly 3 years. This led to another strengthening of the USD and will make the FOMC meeting minutes very interesting as we have seen that inflation is still lagging, although the other data indicates that the economy is progressing well as we also saw with the latest NFP and other data.
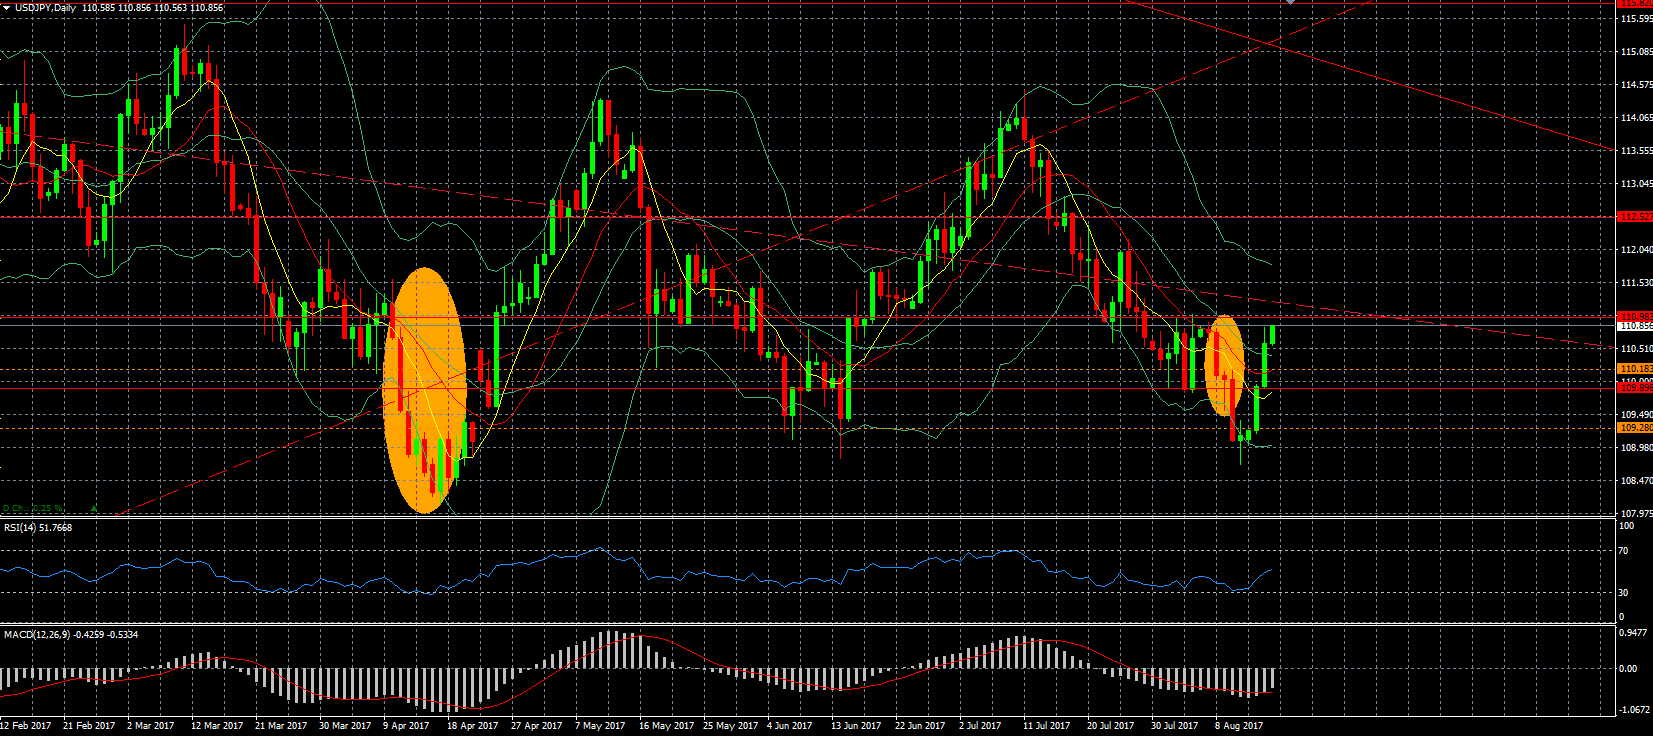
USD/JPY – the JPY continues to weaken as demand for the safe haven continues to lessen and we see an unwinding of JPY positions that were entered when the tensions with North Korea started. However, there have been some reports of an earthquake in North Korea yesterday which leads some to suspect that the country conducted another nuclear test although it was most likely a natural earthquake. Currently we are nearing the resistance just below the 111 level.
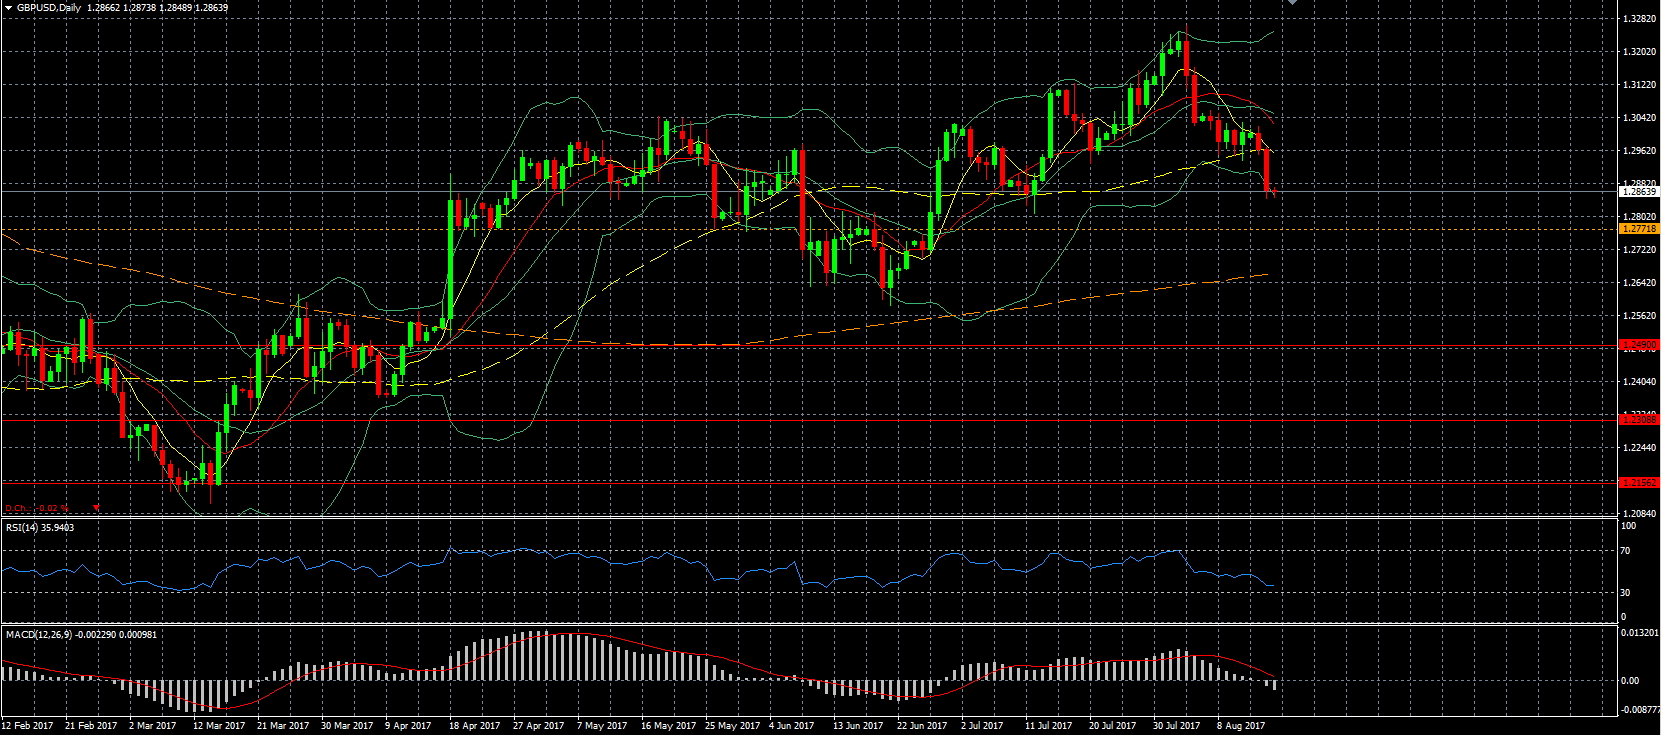
GBP/USD – the GBP was under a lot of pressure yesterday and broke below the range we were trading in for the past week. The GBP was being pulled down due to a strengthening of the USD, which obviously gained steam after the US data in the afternoon, but the weakness of the GBP was triggered by weak inflation data across the board in the UK. The lower inflation data takes even more reasons away for the BOE to raise the interest rate, although inflation is not the only reason for the BOE to raise the interest rate. Today we have employment data out of the UK so we can expect more moves in the GBP.
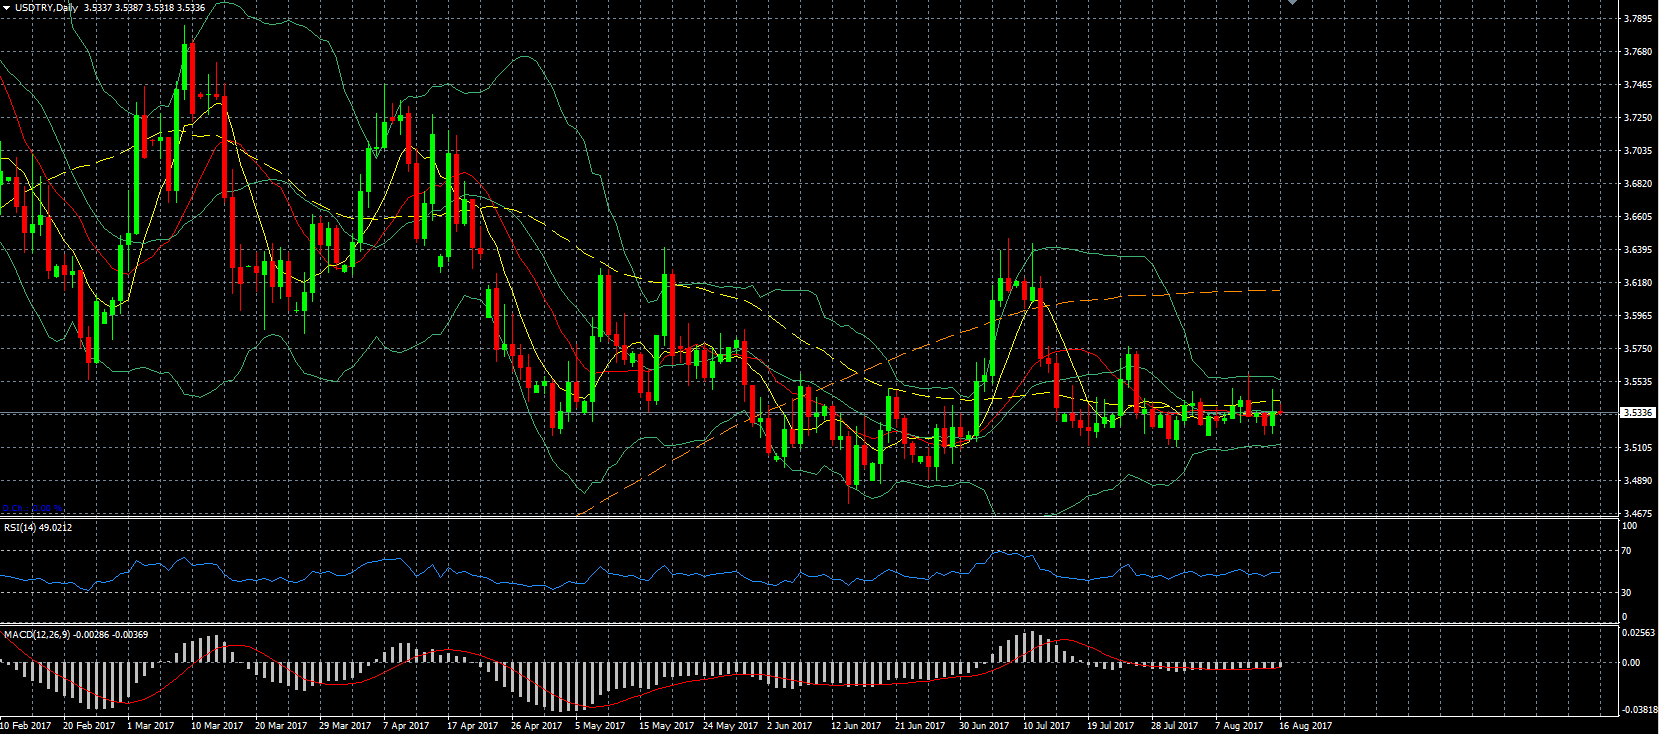
USD/TRY – we are seeing very little volatility here in recent weeks and we can see the Bollinger bands come together which indicates that we can expect a large move in the near future.
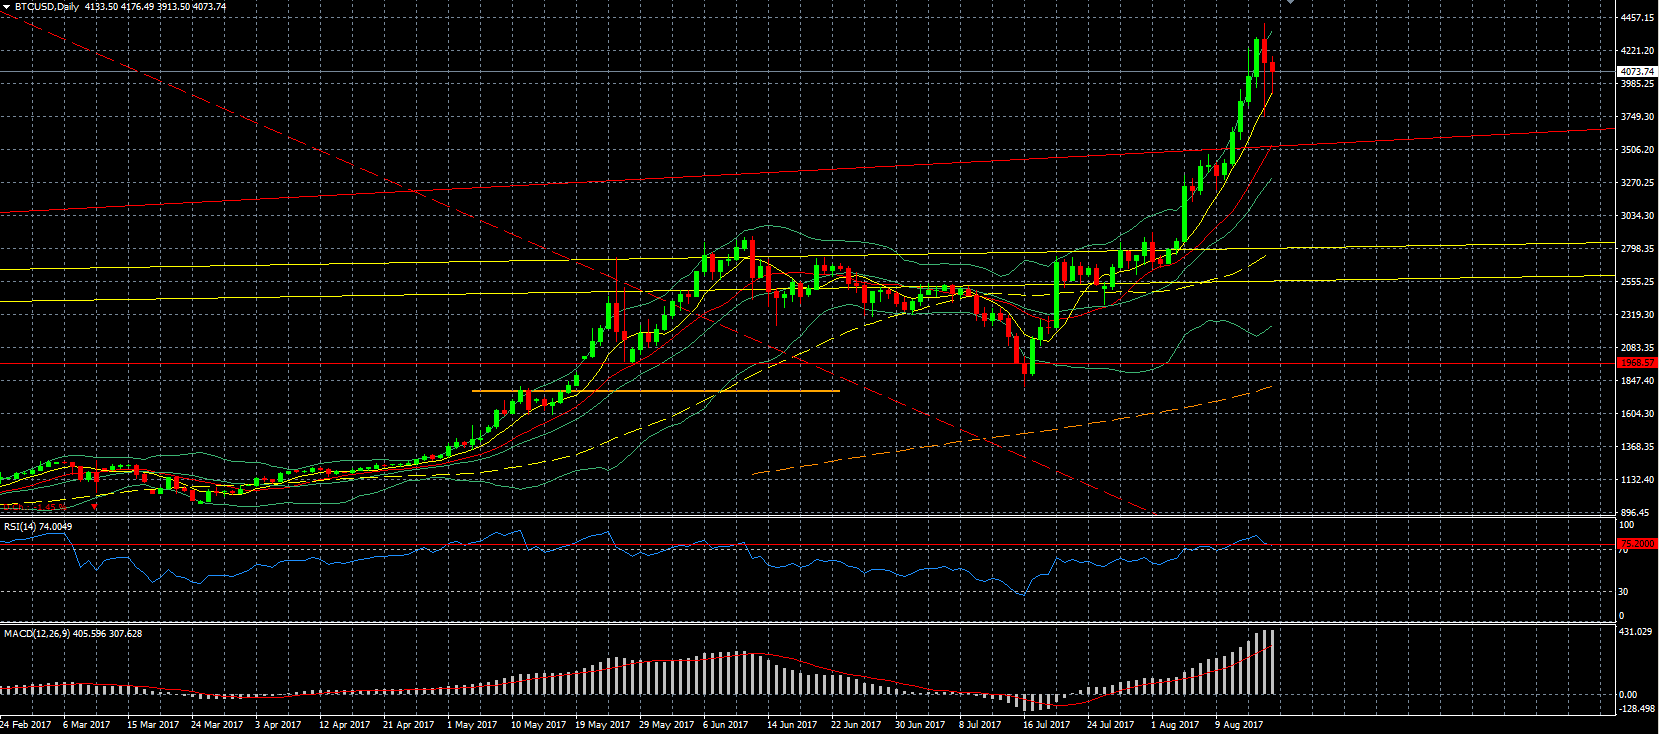
Bitcoin – dropped for the first time in 5 days and is extending the loss to over $300 and this could be related to the warning from Goldman Sachs (NYSE:GS) yesterday that Bitcoin was close for a sharp correction.
Indices
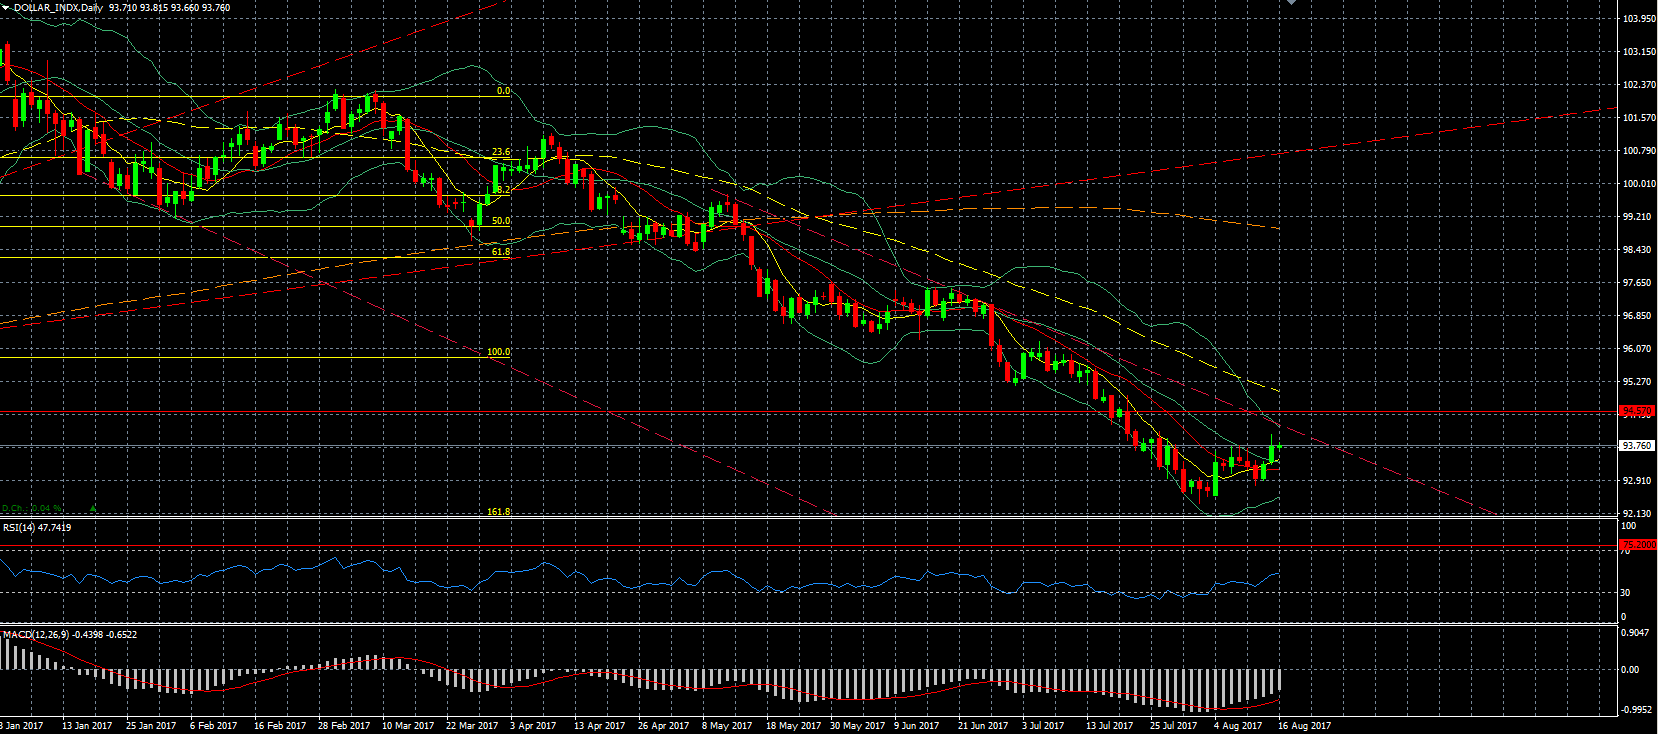
Dollar Index – with more risk appetite in the market and with the strong data the USD kept on growing stronger and is edging closer towards the upper band of the downwards trendline. We have more data today, but without a doubt it will be the FOMC meeting minutes which will decide on the direction. It could very well be that the rates will rise once more this year as we are already anticipating that the balance sheet will start being reduced next month.
S&P 500 – started off strong but shed its gains as the day went by to close lower due to weak earnings reports which took the consumer discretionary index down by nearly 1%. The sector has a weight of over 12% of the S&P and is the fourth largest sector in the index. The technology and consumer sectors posted some gains, but these were not able to make up for the loss of the other sectors. Nevertheless, the strong data out of the US should indicate that the companies are continuing to sell well and next earnings could still be positive, although not everything depends on US sales obviously. The unwinding of the balance sheet could lead to some pressure on the S&P but as it is expected that this will happen slowly and gradually it could end in a having not such a major impact.
Commodities
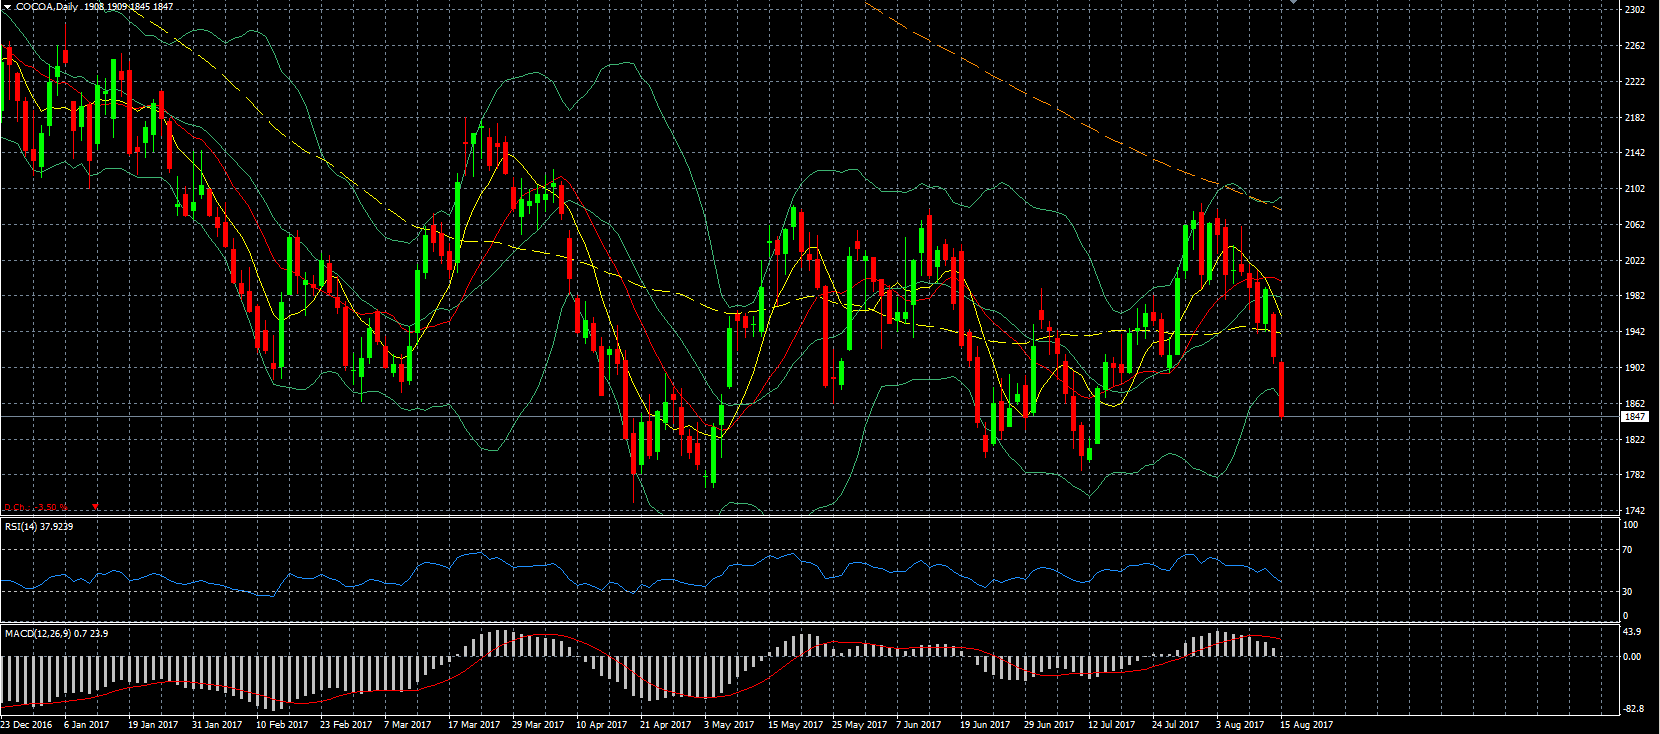
Cocoa – drops sharply along with most other agriculturals are also still in a downtrend after the WASDE report of last week. When looking at the chart we can see that after reaching a high around the 2080 level we drop towards the 1800 level, so we could see cocoa drop to that level before correcting.
Coffee – is dropping sharply amid an oversupply and a general weakness in the sector. Coffee has moved up for the past 7 weeks and this week is paring a lot of those recent gains.
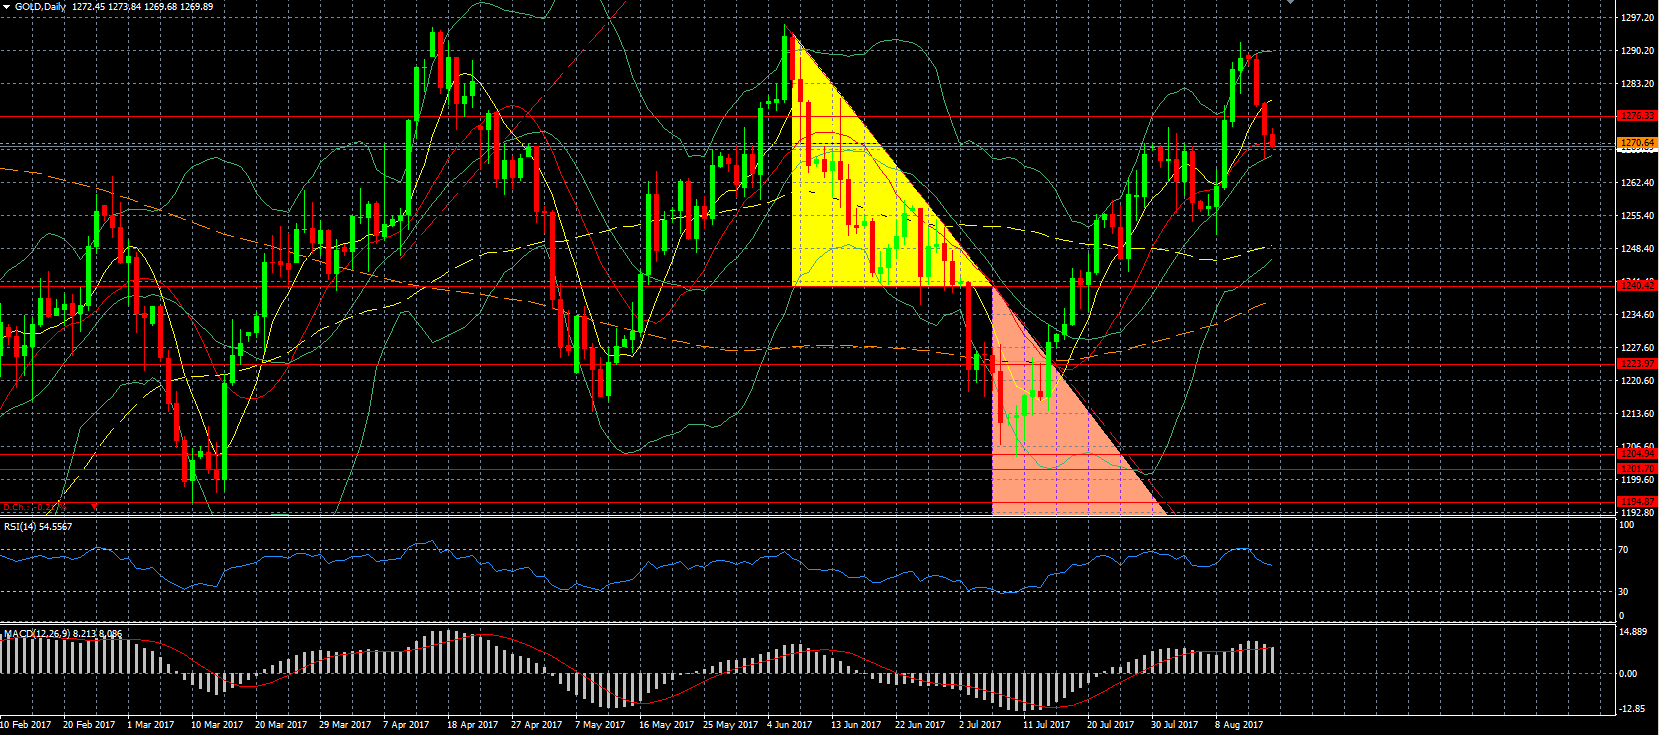
Gold – continues to drop as the USD keeps on strengthening and also the fact that there is more risk appetite is weakening the gold. If from the FOMC meeting minutes it becomes clear that they still tend to see inflation weakness as temporary and that they are still contemplating another rate hike we could see gold drop further.
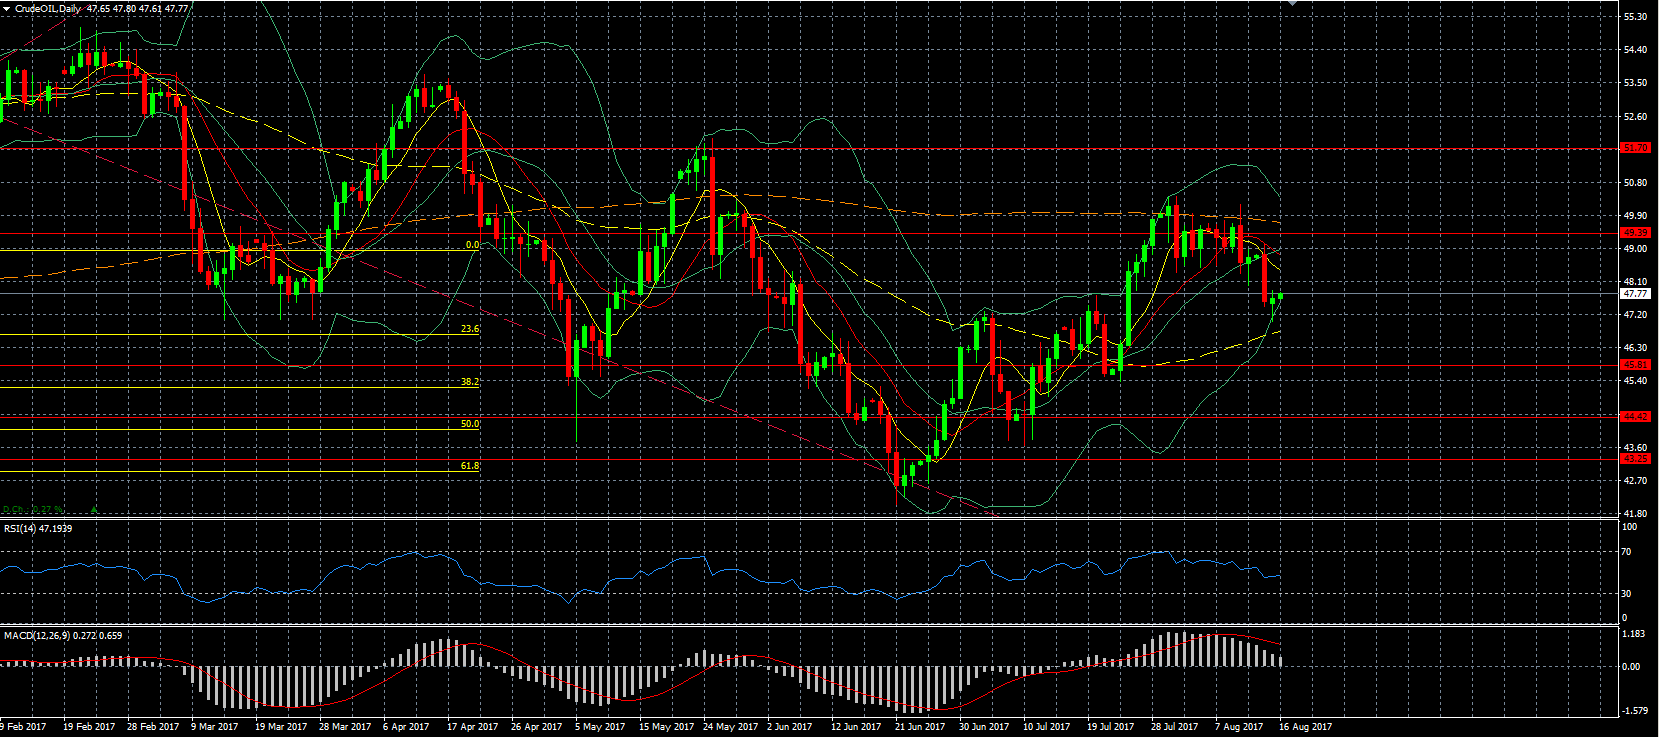
Oil – drop yesterday as oversupply fears still lingered and got an extra boost after Libya announced that production in its largest oil field, Sharara, will be increasing as also its port has resumed operations. This increases the overall OPEC production further, especially since Iraq’s compliance level is quite low. However, oil was able to recover its losses and move higher during the day, and received another boost as the API data showed that the inventories decreased by 9.2 million barrels, much more than was expected. We will wait for the EIA to confirm this number and also see by how much production increased. Shale production in the US is expected to reach record highs next month which weighs on oil, but the continuous and apparently large inventory draws help oil move up. we are seeing that oil has a problem stabilizing above the 50 level in recent weeks and a bearish EIA report will likely only bring us closer and not over that level today as we are trading below the 48 level.
Stocks
Alibaba (NYSE:BABA) – will be releasing its earnings tomorrow before the market opens as a revenue of $7.1 billion is expected.
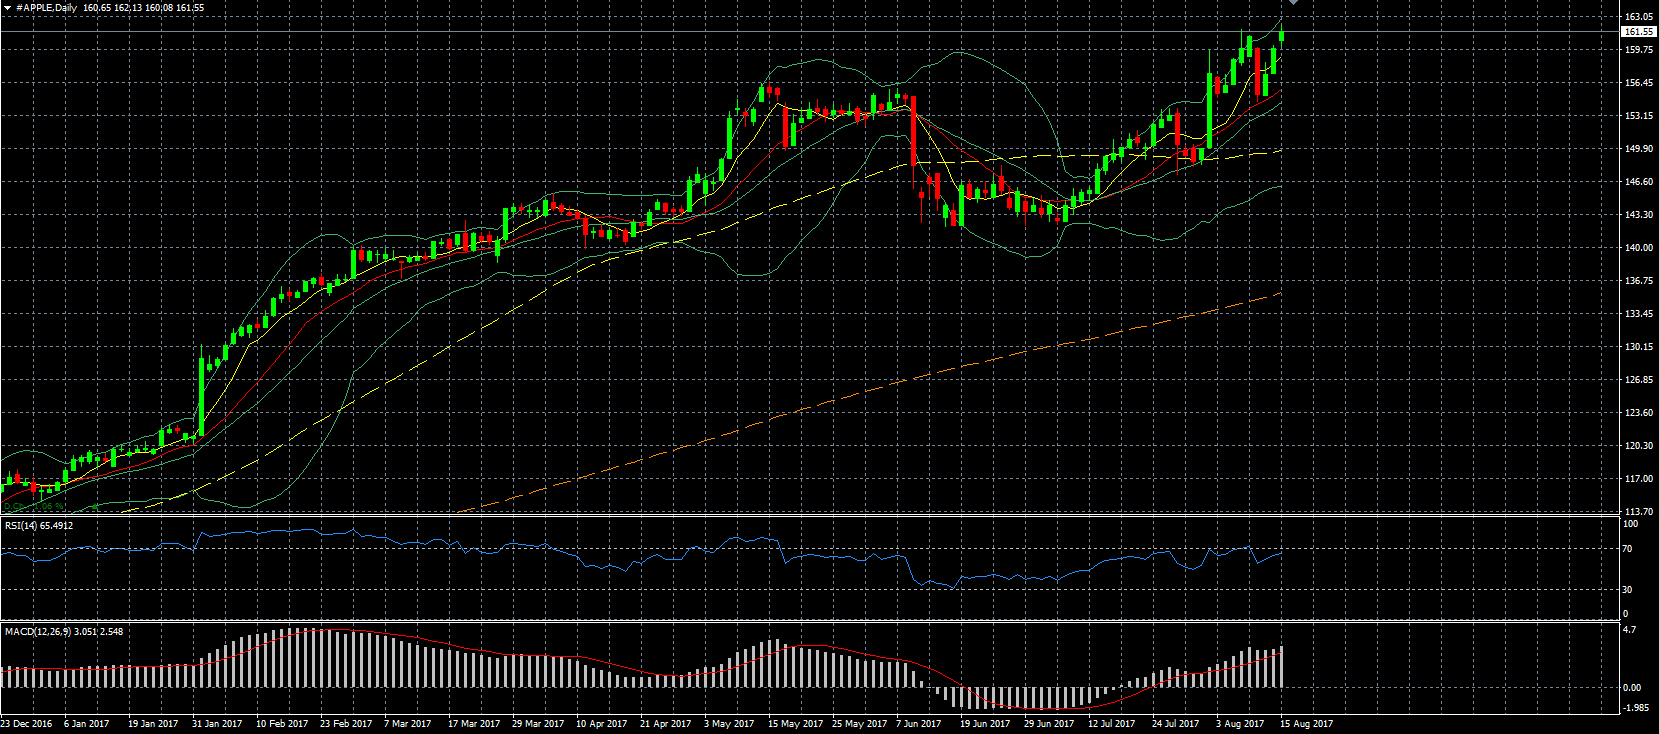
Apple (NASDAQ:AAPL) – has gained over 8% this month after its strong earnings report and there is also a lot of expectation for its new iPhone 8 which is expected to be unveiled, along with other new products, next month.
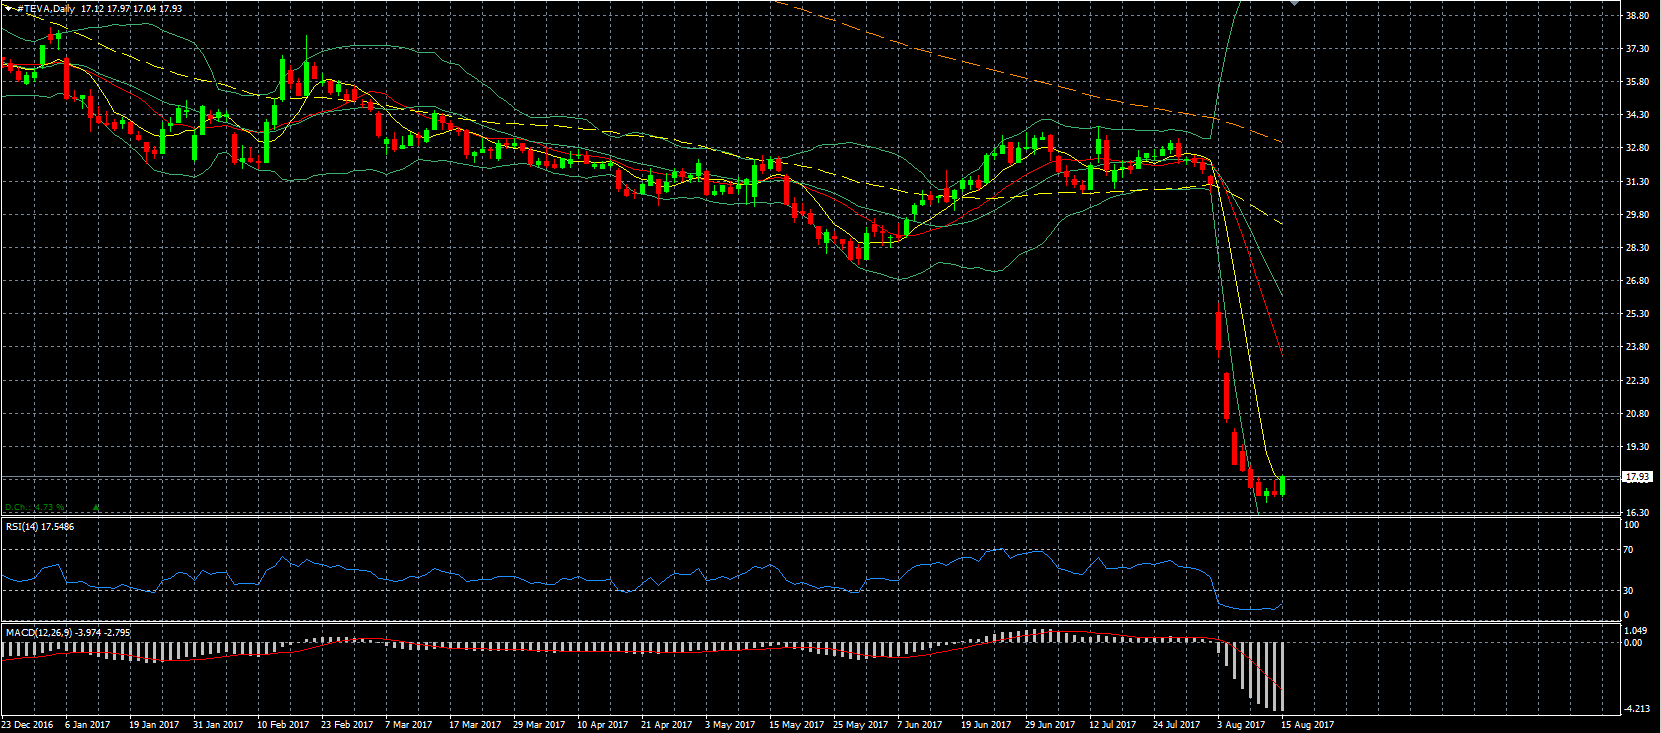
Teva – was able to mark its first significant move up after have shed nearly 50% this month after its very bad earnings report. The question is now if a bottom has been formed around the 17 level or that this is an upwards move to drop further.
