Get 40% Off
⚠ Earnings Alert! Which stocks are poised to surge?
See the stocks on our ProPicks radar. These strategies gained 19.7% year-to-date.
Unlock full list

Stocks Stall Again

Published 06/09/2021, 02:19 AM
Updated 09/20/2023, 06:34 AM

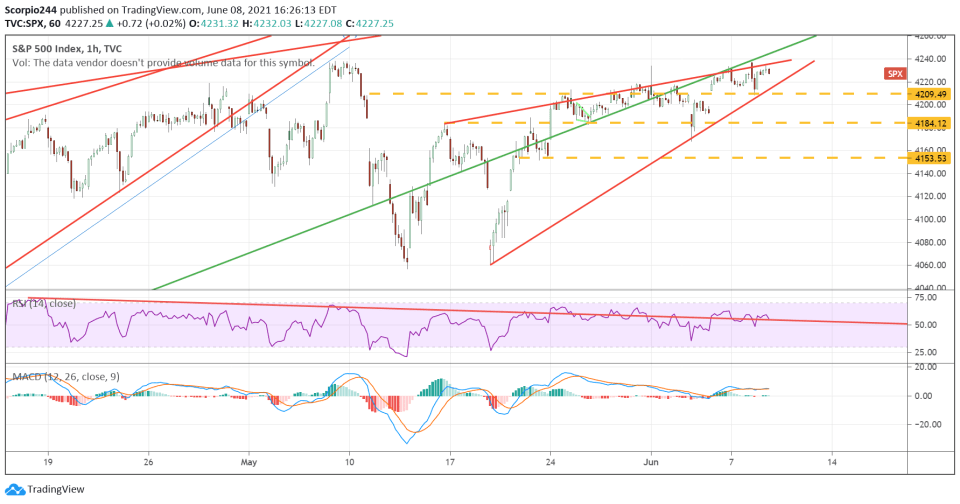
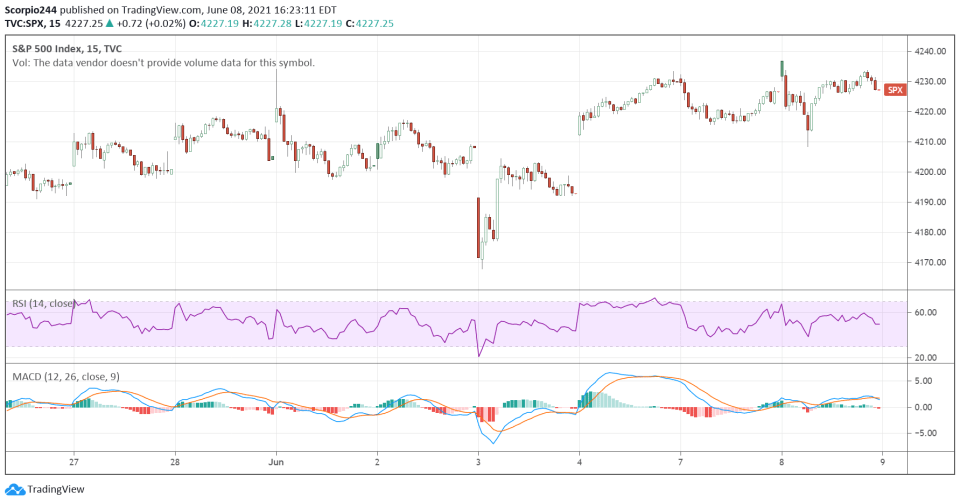
Stocks finished flat once again yesteday, with the S&P 500 up 2bps. There is a fascinating pattern forming here. Since May 27, we have managed to gap higher 6 times, with only one time leading to a higher close on June 4, jobs Friday. The rest of the time, we basically finished the day flat. It suggests that buyers have enough energy to open the market higher, but not enough to finish the job, allowing the sellers to take over. I’m just wondering at what point this pattern breaks and what the result will be.

A rising wedge pattern has formed in the S&P 500 going back to May 17, and if it has anything to say about what happens next, it seems highly likely the index breaks lower. It is, after all, a bearish technical pattern. So we will wait and see how this all goes. But a pullback to 4,190 is certainly a big possibility with more to fall after that.

Russell 2000

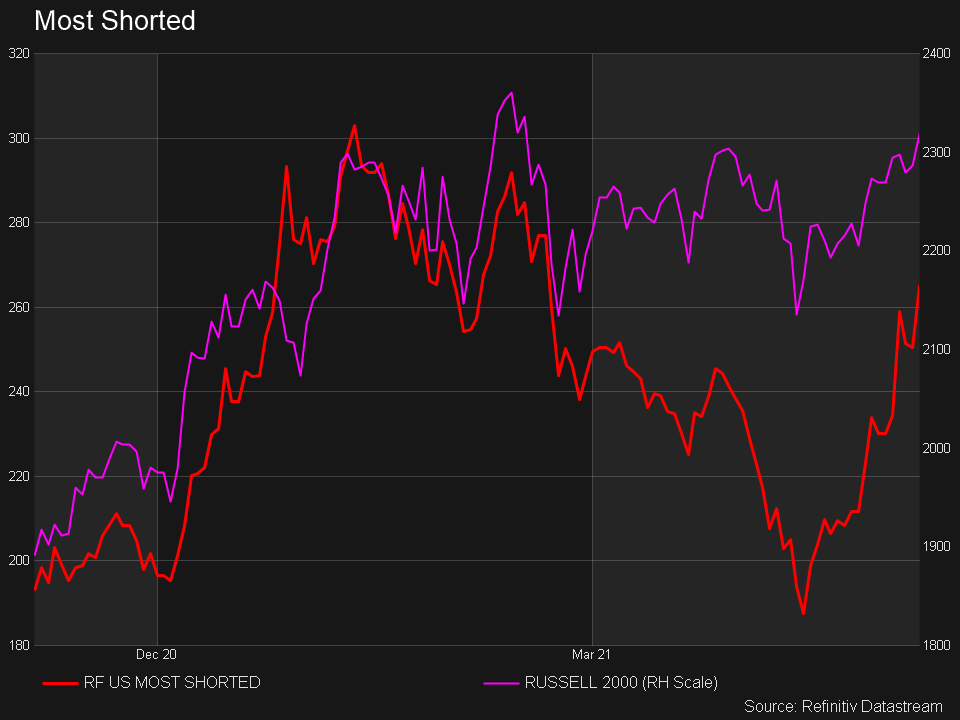
Normally I would consider the Russell 2000 rising as a bullish indicator for the broader market, but that is not the case anymore. The index has been taken over by these most shorted stocks leading the pack. Since the middle of May, it is pretty clear that the most shorted stocks are taking over. The Russell will only continue to go higher for as long the most shorted stocks continue to rise, making me call into question the quality of the rally.

Most Sshorted Stocks

Micron

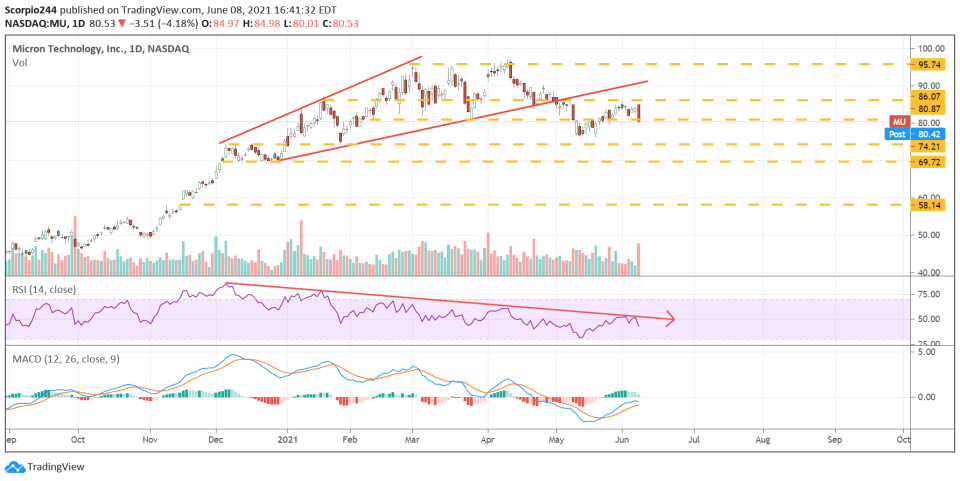
Micron Technology (NASDAQ:MU) did not have a good day at all, volume levels spiked, and the stock moved back to support around $80. There is no sign of the downtrend in the RSI breaking yet, while the MACD appears to be getting ready to roll over as well. These are all bearish trends that suggest a move to $74 is highly likely.

Micron (MU) Daily Chart

Intel

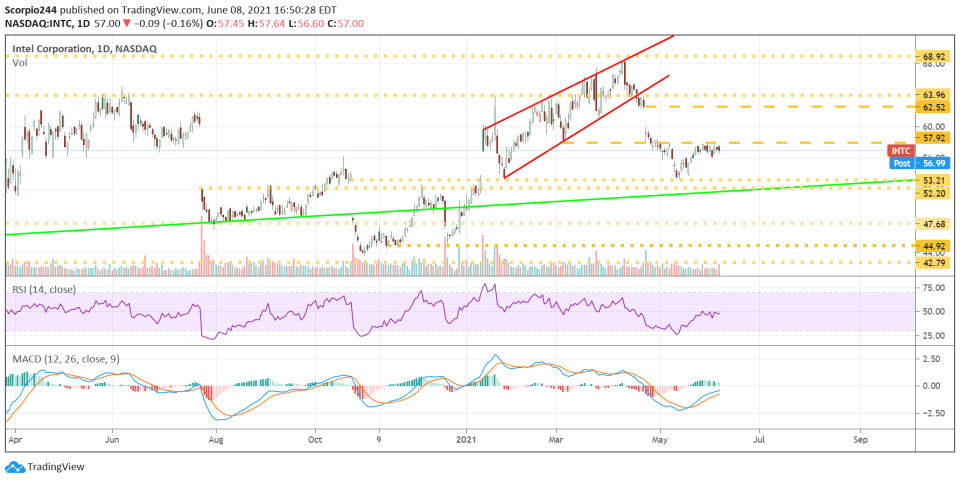
Intel (NASDAQ:INTC) saw some bullish option betting, and I noted it in this morning’s note. The stock is hovering around resistance at $57-58, and it would take a move above $58 to get it to moving higher towards $62.50.

Intel (INTC) Daily Chart

Bank of America

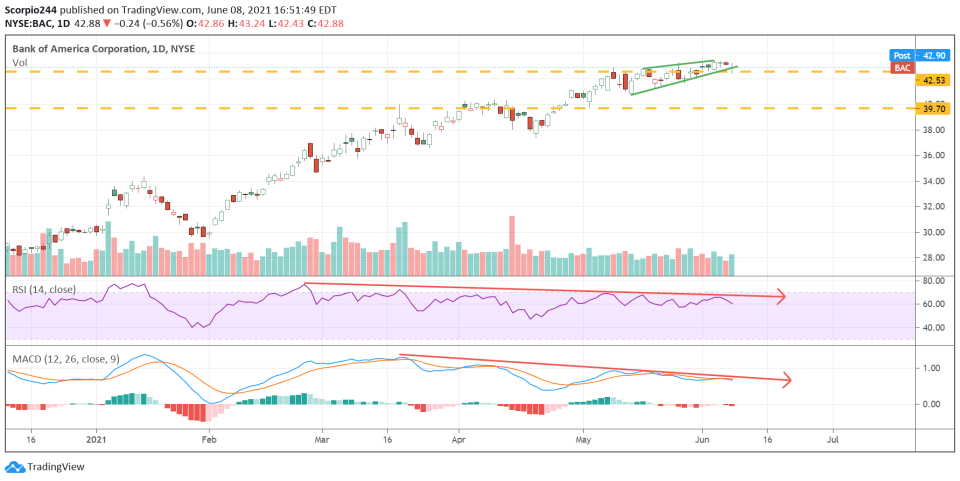
Bank of America (NYSE:BAC) was a stock I saw bearish options betting in last week, and now it appears it may be getting ready to break down. A drop below $42.50 would be a big problem for the shares and likely signal a decline to around $39.70.

Bank of America (BAC) Daily Chart

Deere

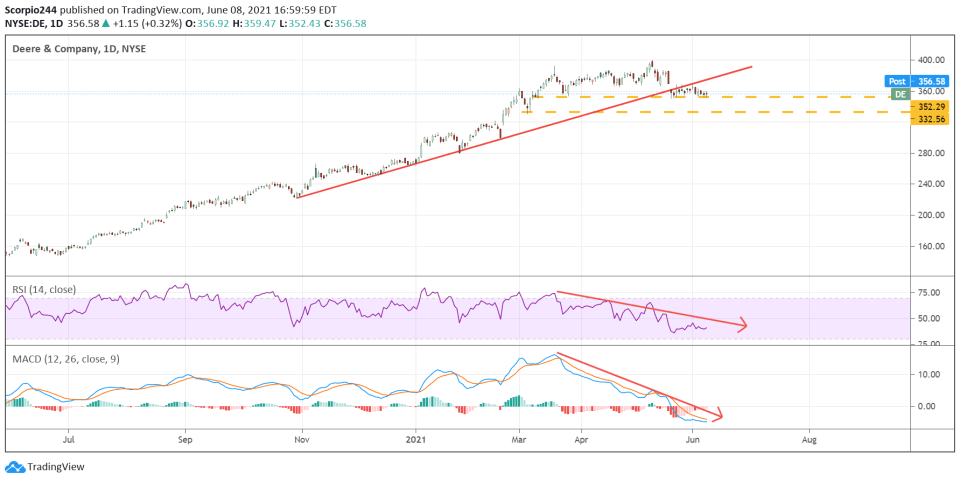
What’s going on with Deere (NYSE:DE)? The stock has broken its uptrend, the RSI and MACD are trending lower, signaling lower prices to come. A break below $350 would signal a further drop to $332.

Deere (DE) Daily Chart

Original Post

Latest comments

it's a dog until earnings......then ?
oh what will the catalyst be? right now the markets are being propped up by hopes & prayers & some people getting vaccinated. we all know whats coming ... the only question is what will the catalyst be?
1) China inflation will lead to interest rates elevation; 2) "Real" USA inflation at a rate of 69% has killed the buying power; 3) Trade war USA x China returning to the scene as Biden seeks approximation to the Europe; S&P500 diving 45% in 15 days soon... What we have now is just a false sensation of wealth (after last FED monetary expansion, US dollar is dead).  Fasten your seat belts!
Thanks
Cosmo?
this is a repeat of what happened a while ago (most shorted small cap stocks rallying the mkts) before sharp declines...
Risk Disclosure: Trading in financial instruments and/or cryptocurrencies involves high risks including the risk of losing some, or all, of your investment amount, and may not be suitable for all investors. Prices of cryptocurrencies are extremely volatile and may be affected by external factors such as financial, regulatory or political events. Trading on margin increases the financial risks.
Before deciding to trade in financial instrument or cryptocurrencies you should be fully informed of the risks and costs associated with trading the financial markets, carefully consider your investment objectives, level of experience, and risk appetite, and seek professional advice where needed.
Fusion Media would like to remind you that the data contained in this website is not necessarily real-time nor accurate. The data and prices on the website are not necessarily provided by any market or exchange, but may be provided by market makers, and so prices may not be accurate and may differ from the actual price at any given market, meaning prices are indicative and not appropriate for trading purposes. Fusion Media and any provider of the data contained in this website will not accept liability for any loss or damage as a result of your trading, or your reliance on the information contained within this website.
It is prohibited to use, store, reproduce, display, modify, transmit or distribute the data contained in this website without the explicit prior written permission of Fusion Media and/or the data provider. All intellectual property rights are reserved by the providers and/or the exchange providing the data contained in this website.
Fusion Media may be compensated by the advertisers that appear on the website, based on your interaction with the advertisements or advertisers.
© 2007-2024 - Fusion Media Limited. All Rights Reserved.