Get 40% Off
🚨 Volatile Markets? Find Hidden Gems for Serious OutperformanceFind Stocks Now

Stocks Rebound As Bitcoin Melts; Gold Breaks Out

Published 04/22/2021, 12:13 AM
Updated 09/20/2023, 06:34 AM

Stocks advanced on Wednesday, erasing all of Tuesday’s losses and more. The S&P 500 finished the day up 93 bps and closed at 4,173. Meanwhile, the NASDAQ 100 ETF (QQQ) rose by around 86 bps, closing around $339.

The S&P 500 is poised to close the gap at 4,185. That is the next level to look for, and a move to that level will tell us a lot about what happens thereafter. Clearly, if it moves above 4,185; there is a good chance we move up to 4,240. If we fail, at 4,185, there is a good chance we revert and move to retest 4,125.

The bears had a lot going their way yesterday, especially with Netflix (NASDAQ:NFLX) down sharply. But they simply didn’t show up to play the game.
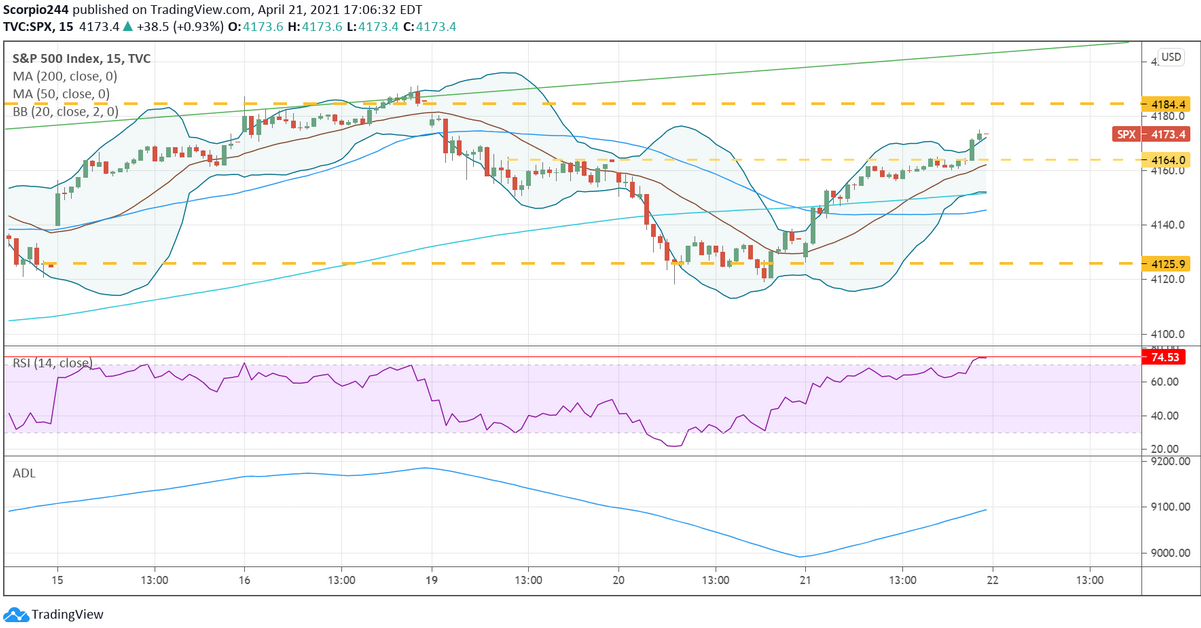
S&P 500 Index Chart

After-hours the S&P 500 E-mini futures, were finding resistance at the uptrend that formed on April 7. This could prove to be a retest of the break in trend, and move lower.
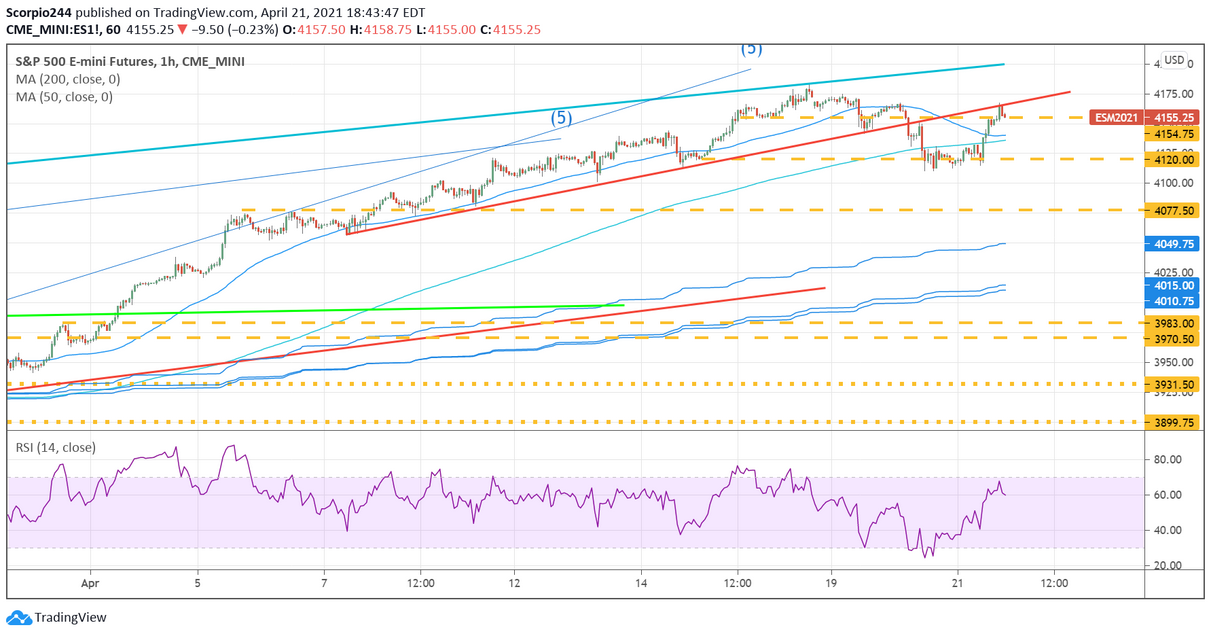
S&P 500 Emini Futures 1-Hr Chart

Bitcoin isn’t helping. It is breaking a very bearish pattern. The pattern in Bitcoin is on the hourly chart and is negative—a bear pennant. The wave count suggests the next break is lower too.
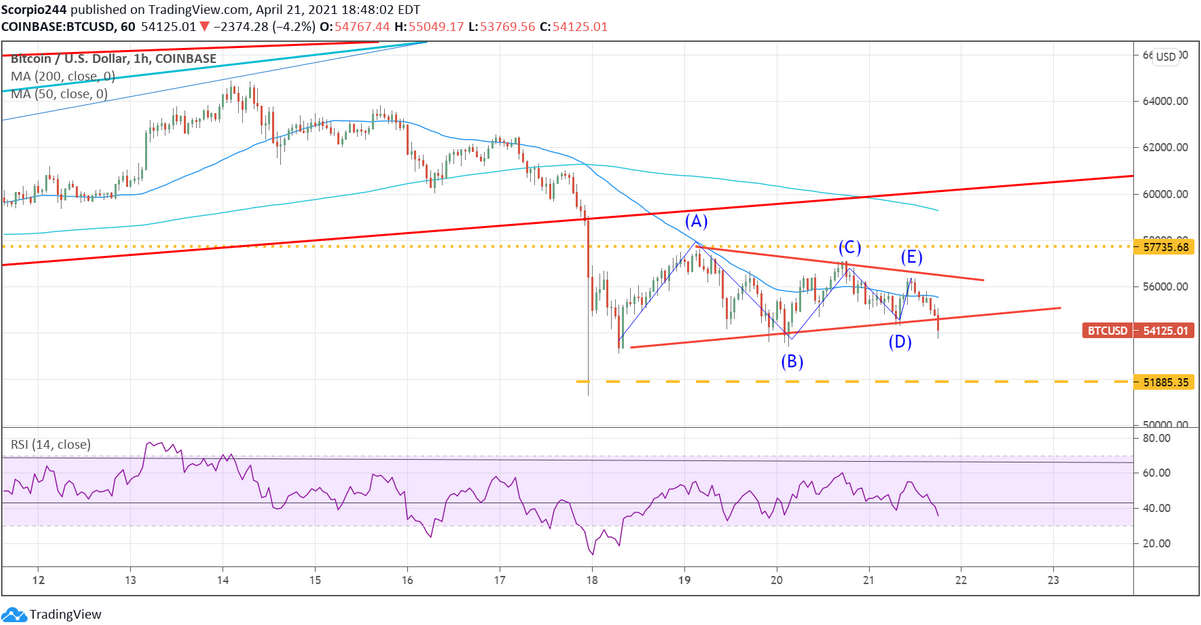
Coinbase 1-Hr Chart

The relative strength index is breaking to a new low, also suggesting lower prices ahead for Bitcoin. The target price level would be around $51,900, but it could be much lower, with the level to look for $45,000.
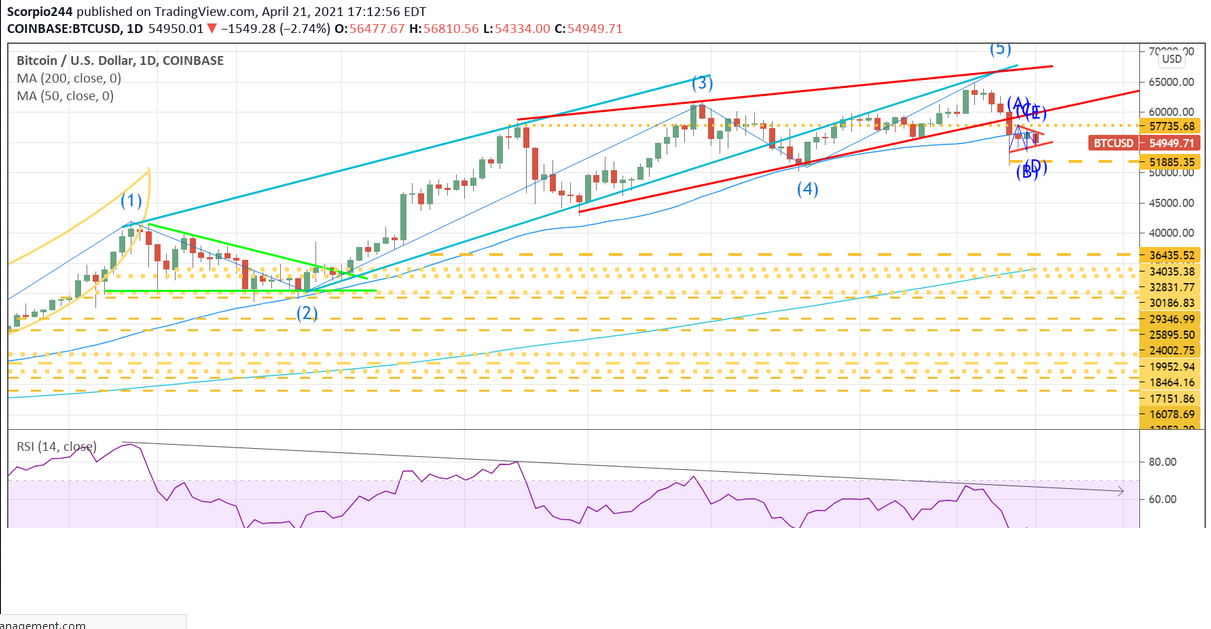
BTC/USD Daily Chart

Gold

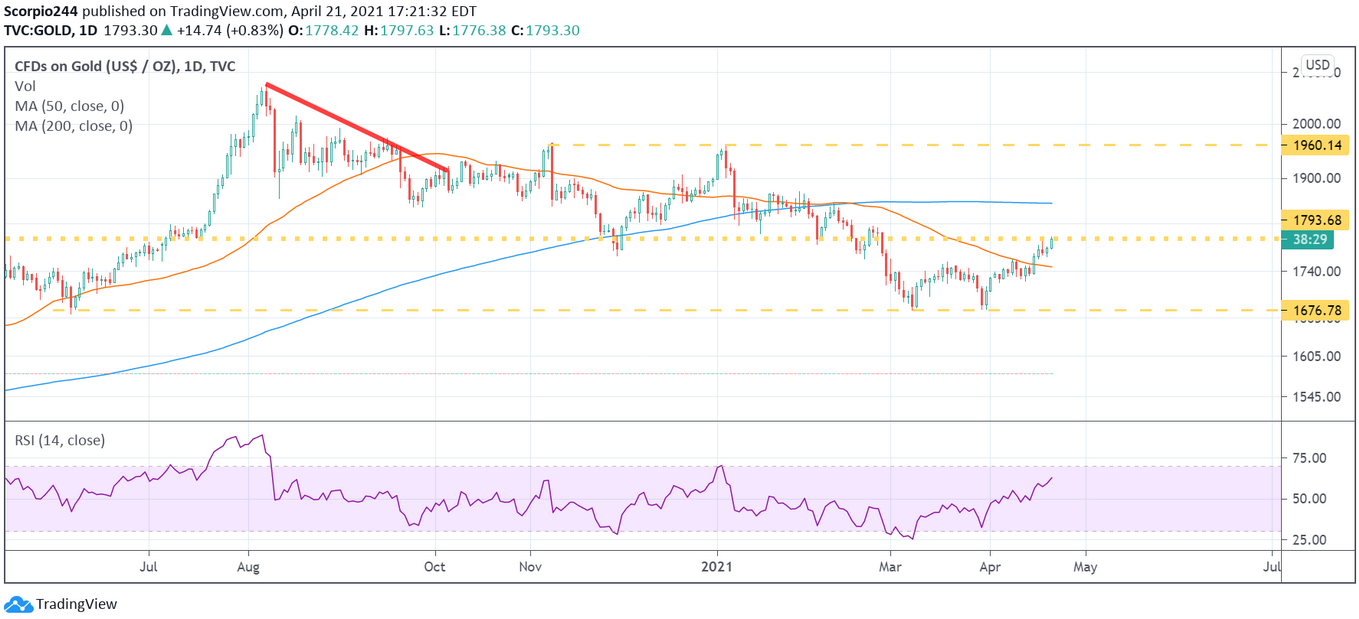
Gold has been pushing higher recently, after finding support around $1,675. It may even be forming a double bottom off of support. A push above $1,800 likely confirms the double bottom pattern and the potential to push up to $1915.
3rd party Ad. Not an offer or recommendation by Investing.com. See disclosure here or remove ads .

Gold Daily Chart

Microsoft

Yesterday, I noted that I thought Microsoft (NASDAQ:MSFT) could run up to around $275.
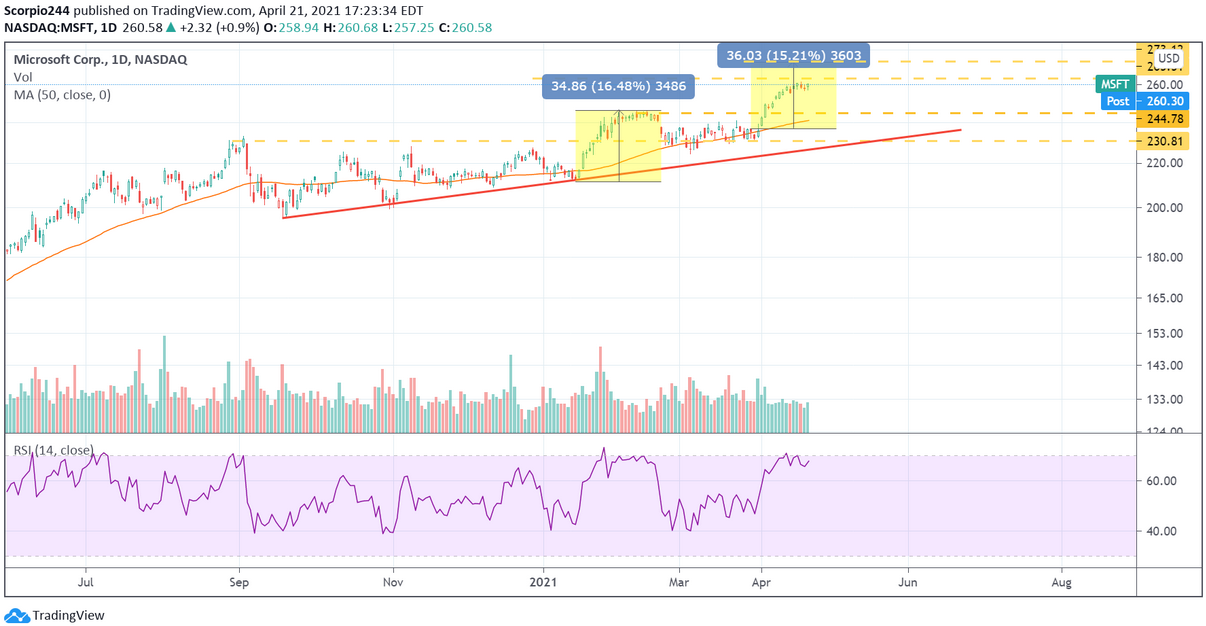
MSFT Daily Chart

Roku

I thought Roku (NASDAQ:ROKU) would be down on Wednesday given Netflix’s results. The stock is still overvalued in my opinion, and I tend to think Vizio (NYSE:VZIO) now offers a direct peer.
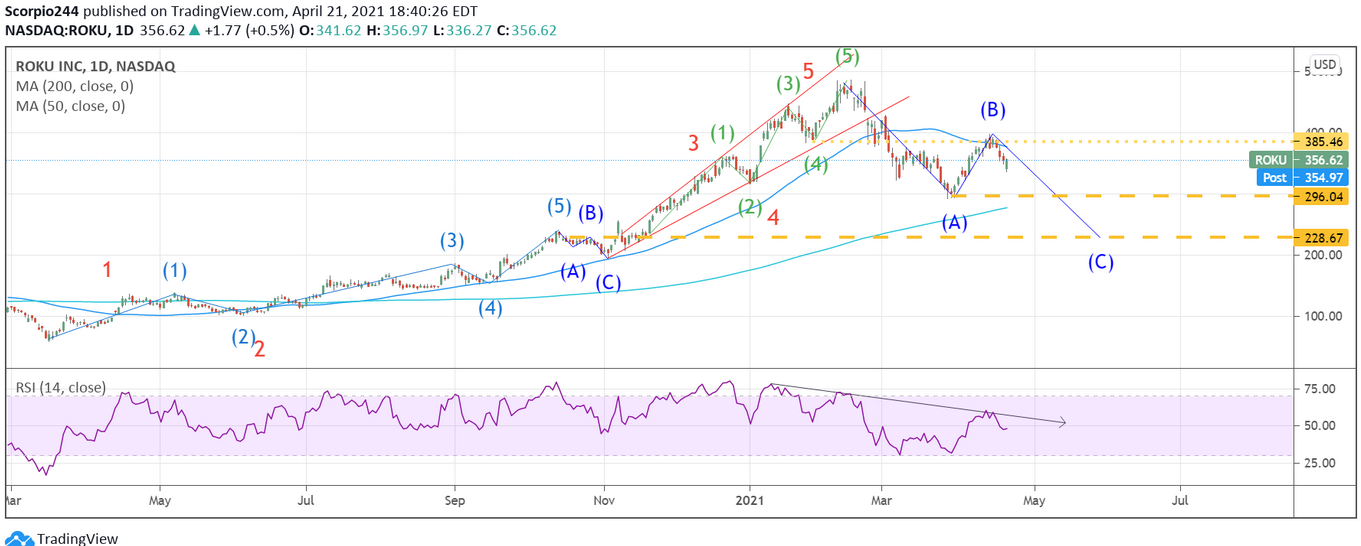
Roku Inc Daily Chart

Original Post

Latest comments

Bitcoin melting ??   Not really.  This pull back is just the usual ups and downs and the daily traders play in the markets.  Overall,  bitcoin has been marching higher and giving better returns than Anything else.
A lot of people dont know much about cryptos bro, they apply the same price movement logic to cryptos they use on stocks.
since when did bit melt? its still above 50.
Risk Disclosure: Trading in financial instruments and/or cryptocurrencies involves high risks including the risk of losing some, or all, of your investment amount, and may not be suitable for all investors. Prices of cryptocurrencies are extremely volatile and may be affected by external factors such as financial, regulatory or political events. Trading on margin increases the financial risks.
Before deciding to trade in financial instrument or cryptocurrencies you should be fully informed of the risks and costs associated with trading the financial markets, carefully consider your investment objectives, level of experience, and risk appetite, and seek professional advice where needed.
Fusion Media would like to remind you that the data contained in this website is not necessarily real-time nor accurate. The data and prices on the website are not necessarily provided by any market or exchange, but may be provided by market makers, and so prices may not be accurate and may differ from the actual price at any given market, meaning prices are indicative and not appropriate for trading purposes. Fusion Media and any provider of the data contained in this website will not accept liability for any loss or damage as a result of your trading, or your reliance on the information contained within this website.
It is prohibited to use, store, reproduce, display, modify, transmit or distribute the data contained in this website without the explicit prior written permission of Fusion Media and/or the data provider. All intellectual property rights are reserved by the providers and/or the exchange providing the data contained in this website.
Fusion Media may be compensated by the advertisers that appear on the website, based on your interaction with the advertisements or advertisers.
© 2007-2024 - Fusion Media Limited. All Rights Reserved.