
On my blog, I often discuss companies with a low volatile business and good yields. Today I would like to use the gurufocus screener to focus on predictable companies.
The screener gave me the opportunity to look for new, customized stock ideas. Below is a list of the best yielding cheaply valuated stocks with yields over 3 percent as well as a forward P/E under 15.
Eighteen stocks with a better than 4-Star gurufocus rating fulfilled the above mentioned criteria. Three of the results have a high yield and four are currently recommended to buy or even better.
Novartis (NVS) has a market capitalization of $185.42 billion. The company employs 127,724 people, generates revenue of $57.561 billion and has a net income of $9.618 billion. Novartis’s earnings before interest, taxes, depreciation and amortization (EBITDA) amounts to $16.848 billion. The EBITDA margin is 29.27 percent (the operating margin is 20.00 percent and the net profit margin 16.71 percent).
Financial Analysis: The total debt represents 15.88 percent of Novartis’s assets and the total debt in relation to the equity amounts to 28.55 percent. Due to the financial situation, a return on equity of 14.09 percent was realized by Novartis. Twelve trailing months earnings per share reached a value of $3.81. Last fiscal year, Novartis paid $2.30 in the form of dividends to shareholders. Forward P/E: 14.13.
Market Valuation: Here are the price ratios of the company: The P/E ratio is 19.87, the P/S ratio is 3.54 and the P/B ratio is finally 2.66. The dividend yield amounts to 3.20 percent and the beta ratio has a value of 0.62.
China Petroleum & Chemical (SNP) has a market capitalization of $73.79 billion. The company employs 376,201 people, generates revenue of $455.221 billion and has a net income of $10.914 billion. China Petroleum & Chemical’s earnings before interest, taxes, depreciation and amortization (EBITDA) amounts to $27.817 billion. The EBITDA margin is 6.11 percent (the operating margin is 3.54 percent and the net profit margin 2.40 percent).
Financial Analysis: The total debt represents 21.95 percent of China Petroleum & Chemical’s assets and the total debt in relation to the equity amounts to 54.43 percent. Due to the financial situation, a return on equity of 12.99 percent was realized by China Petroleum & Chemical. Twelve trailing months earnings per share reached a value of $8.89. Last fiscal year, China Petroleum & Chemical paid $3.77 in the form of dividends to shareholders. Forward P/E: 6.84.
Market Valuation: Here are the price ratios of the company: The P/E ratio is 9.03, the P/S ratio is 0.19 and the P/B ratio is finally 0.86. The dividend yield amounts to 5.08 percent and the beta ratio has a value of 0.83.
The Bank of Nova Scotia (BNS) has a market capitalization of $69.53 billion. The company employs 83,416 people, generates revenue of $16.491 billion and has a net income of $6.216 billion. The Bank of Nova Scotia’s earnings before interest, taxes, depreciation and amortization (EBITDA) amounts to $9.198 billion. The EBITDA margin is 55.78 percent (the operating margin is 40.84 percent and the net profit margin 32.82 percent).
Financial Analysis: The total debt represents 10.25 percent of The Bank of Nova Scotia’s assets and the total debt in relation to the equity amounts to 172.70 percent. Due to the financial situation, a return on equity of 19.55 percent was realized by The Bank of Nova Scotia. Twelve trailing months earnings per share reached a value of $4.84. Last fiscal year, The Bank of Nova Scotia paid $2.11 in the form of dividends to shareholders. Forward P/E: 10.85.
Market Valuation: Here are the price ratios of the company: The P/E ratio is 11.94, the P/S ratio is 3.67 and the P/B ratio is finally 2.02. The dividend yield amounts to 4.11 percent and the beta ratio has a value of 1.28.
Rogers Communications (RCI) has a market capitalization of $22.42 billion. The company employs 28,745 people, generates revenue of $12.486 billion and has a net income of $1.732 billion. Rogers Communications’s earnings before interest, taxes, depreciation and amortization (EBITDA) amounts to $4.757 billion. The EBITDA margin is 38.10 percent (the operating margin is 22.15 percent and the net profit margin 13.87 percent).
Financial Analysis: The total debt represents 55.00 percent of Rogers Communications’s assets and the total debt in relation to the equity amounts to 286.33 percent. Due to the financial situation, a return on equity of 47.19 percent was realized by Rogers Communications. Twelve trailing months earnings per share reached a value of $3.63. Last fiscal year, Rogers Communications paid $1.58 in the form of dividends to shareholders. Forward P/E: 11.96.
Market Valuation: Here are the price ratios of the company: The P/E ratio is 11.99, the P/S ratio is 1.79 and the P/B ratio is finally 5.88. The dividend yield amounts to 4.04 percent and the beta ratio has a value of 0.28.
Take a closer look at the full list of cheap stocks with a predictable business. The average P/E ratio amounts to 12.66 and forward P/E ratio is 11.54. The dividend yield has a value of 4.55 percent. Price to book ratio is 2.65 and price to sales ratio 1.97. The operating margin amounts to 25.77 percent and the beta ratio is 0.76. Stocks from the list have an average debt to equity ratio of 0.98.
Here is the full table with some fundamentals (TTM): 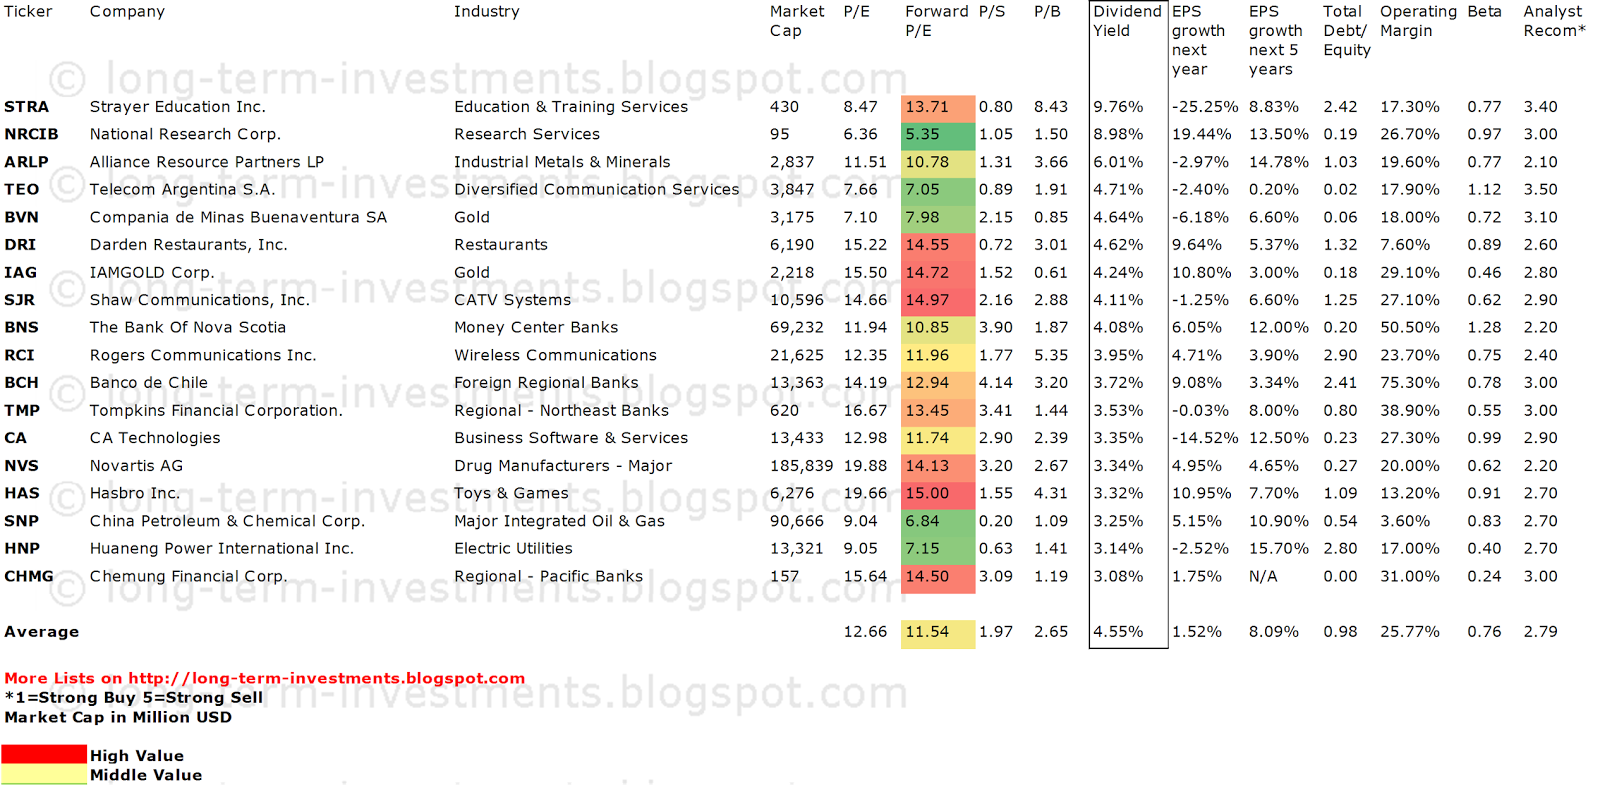
Related Stock Ticker Symbols:
STRA, NRCIB, ARLP, TEO, BVN, DRI, IAG, SJR, BNS, RCI, BCH, TMP, CA, NVS, HAS, SNP,
HNP, CHMG
*I am long DRI, RCI, CA, HAS. I receive no compensation to write about these specific stocks, sector or theme. I don't plan to increase or decrease positions or obligations within the next 72 hours.
For the other stocks: I have no positions in any stocks mentioned, and no plans to initiate any positions within the next 72 hours. I receive no compensation to write about any specific stock, sector or theme.
- English (UK)
- English (India)
- English (Canada)
- English (Australia)
- English (South Africa)
- English (Philippines)
- English (Nigeria)
- Deutsch
- Español (España)
- Español (México)
- Français
- Italiano
- Nederlands
- Português (Portugal)
- Polski
- Português (Brasil)
- Русский
- Türkçe
- العربية
- Ελληνικά
- Svenska
- Suomi
- עברית
- 日本語
- 한국어
- 简体中文
- 繁體中文
- Bahasa Indonesia
- Bahasa Melayu
- ไทย
- Tiếng Việt
- हिंदी
Stocks Picks: Dividend Yields Over 3%, A Predictable Business Model
Published 09/10/2013, 05:38 AM
Updated 07/09/2023, 06:31 AM
Stocks Picks: Dividend Yields Over 3%, A Predictable Business Model
3rd party Ad. Not an offer or recommendation by Investing.com. See disclosure here or
remove ads
.
Latest comments
Install Our App
Risk Disclosure: Trading in financial instruments and/or cryptocurrencies involves high risks including the risk of losing some, or all, of your investment amount, and may not be suitable for all investors. Prices of cryptocurrencies are extremely volatile and may be affected by external factors such as financial, regulatory or political events. Trading on margin increases the financial risks.
Before deciding to trade in financial instrument or cryptocurrencies you should be fully informed of the risks and costs associated with trading the financial markets, carefully consider your investment objectives, level of experience, and risk appetite, and seek professional advice where needed.
Fusion Media would like to remind you that the data contained in this website is not necessarily real-time nor accurate. The data and prices on the website are not necessarily provided by any market or exchange, but may be provided by market makers, and so prices may not be accurate and may differ from the actual price at any given market, meaning prices are indicative and not appropriate for trading purposes. Fusion Media and any provider of the data contained in this website will not accept liability for any loss or damage as a result of your trading, or your reliance on the information contained within this website.
It is prohibited to use, store, reproduce, display, modify, transmit or distribute the data contained in this website without the explicit prior written permission of Fusion Media and/or the data provider. All intellectual property rights are reserved by the providers and/or the exchange providing the data contained in this website.
Fusion Media may be compensated by the advertisers that appear on the website, based on your interaction with the advertisements or advertisers.
© 2007-2024 - Fusion Media Limited. All Rights Reserved.