Get 40% Off
🚨 Volatile Markets? Find Hidden Gems for Serious OutperformanceFind Stocks Now

Stocks Headed For Choppy Action After Strong Week

Published 01/07/2018, 02:27 PM
Updated 07/09/2023, 06:31 AM

Summary:
· The S&P 500 moved higher last week, rising by 2.2%.
· This was driven in part by strong economic data, including manufacturing, construction spending, and job growth.
· Our projection for the stock market next week is for choppy price action with the market angling lower overall.

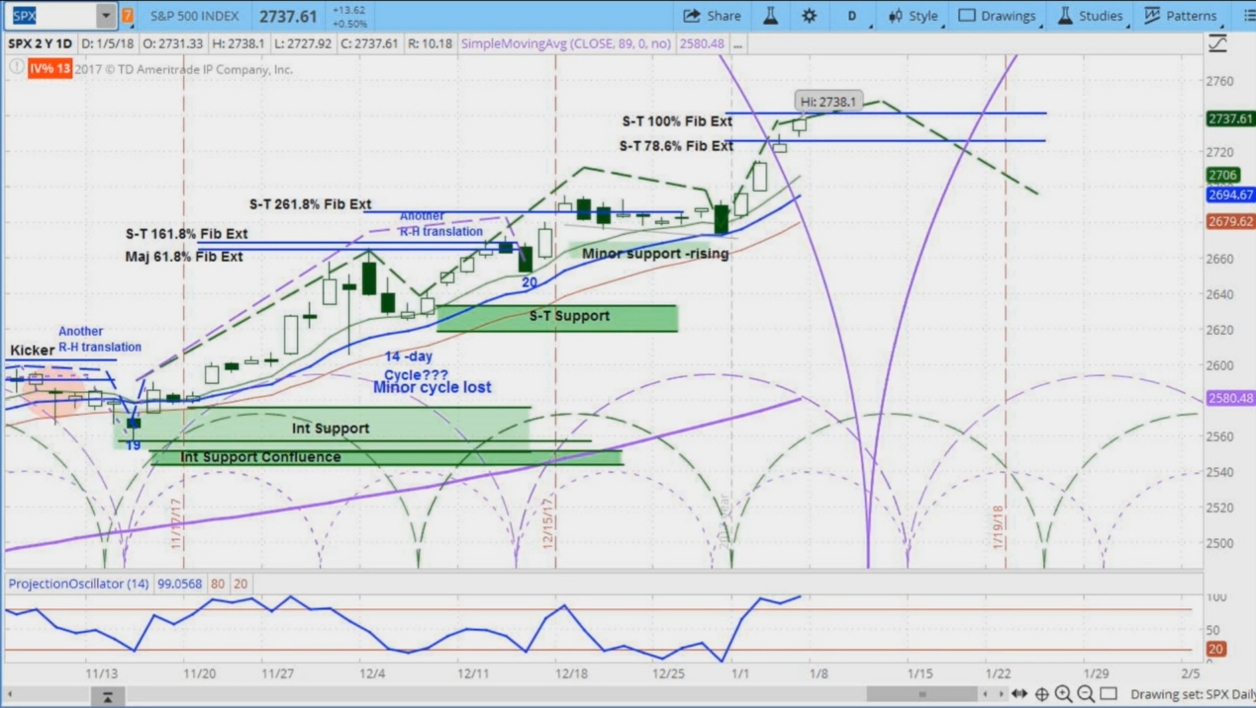
Daily chart for the S&P 500 (SPX)

The stock market moved higher last week, with the S&P 500 (SPX) moving up 60 points to 2743, a new record high.

The markets were closed on Monday. On Tuesday, Amazon (NASDAQ:AMZN) announced that it shipped over 5 billion items under its Prime membership in 2017. Its stock price was up 1.7% for the day.

On Wednesday, the US Commerce Department announced that construction spending rose 0.8% in November, hitting an all-time high of $1.257 trillion. As well, the Institute of Supply Management (ISM) announced that its Purchasing Manager’s Index rose to 59.7% in December from 58.2% in November.

Also, the Federal Open Markets Committee released the minutes from its most recent meeting. It appears the Fed is still expecting 3 rate hikes in 2018 and is increasingly concerned about a flattening yield curve.

On Thursday, Automatic Data Processing (ADP) released its estimate for private sector job creation of 250,000 in December, which was higher than the 188,000 expected. ADP also revised its estimate for November down by 5,000.

On Friday, the Department of Labor released its estimate which showed that 148,000 jobs were created in December. This was lower that the 190,000 jobs that the market was expecting, and while the market dipped briefly, it later resumed its upside move.

3rd party Ad. Not an offer or recommendation by Investing.com. See disclosure here or remove ads .

The daily chart above shows our projection for the S&P 500 (SPX) in the coming week: a small choppy down week, with the Fibonacci extension levels, around Friday’s close, providing a reasonable area of resistance. The green-dotted half circles represent the short-term market cycles for Russell 2000 (RUT). The RUT market cycles appear to be driving SPX price more so than the SPX cycles.

Latest comments

Risk Disclosure: Trading in financial instruments and/or cryptocurrencies involves high risks including the risk of losing some, or all, of your investment amount, and may not be suitable for all investors. Prices of cryptocurrencies are extremely volatile and may be affected by external factors such as financial, regulatory or political events. Trading on margin increases the financial risks.
Before deciding to trade in financial instrument or cryptocurrencies you should be fully informed of the risks and costs associated with trading the financial markets, carefully consider your investment objectives, level of experience, and risk appetite, and seek professional advice where needed.
Fusion Media would like to remind you that the data contained in this website is not necessarily real-time nor accurate. The data and prices on the website are not necessarily provided by any market or exchange, but may be provided by market makers, and so prices may not be accurate and may differ from the actual price at any given market, meaning prices are indicative and not appropriate for trading purposes. Fusion Media and any provider of the data contained in this website will not accept liability for any loss or damage as a result of your trading, or your reliance on the information contained within this website.
It is prohibited to use, store, reproduce, display, modify, transmit or distribute the data contained in this website without the explicit prior written permission of Fusion Media and/or the data provider. All intellectual property rights are reserved by the providers and/or the exchange providing the data contained in this website.
Fusion Media may be compensated by the advertisers that appear on the website, based on your interaction with the advertisements or advertisers.
© 2007-2024 - Fusion Media Limited. All Rights Reserved.