Get 40% Off
👀 👁 🧿 All eyes on Biogen, up +4,56% after posting earnings. Our AI picked it in March 2024.
Which stocks will surge next?
Unlock AI-picked Stocks

Stocks Grow Even More Overextended

Published 04/16/2021, 01:10 AM
Updated 09/20/2023, 06:34 AM

Stocks rose today in a surprising move, but very little actually changed from a technical perspective. What did change was that the index became even more overbought, with an RSI now at 73.3. There is also a reasonable amount of resistance, around 4,180, based on a Fibonacci extension from the Mar. 4 lows. Again, my viewpoint has not changed, the market is overextended, and I expect to see a drop back to 3,960.
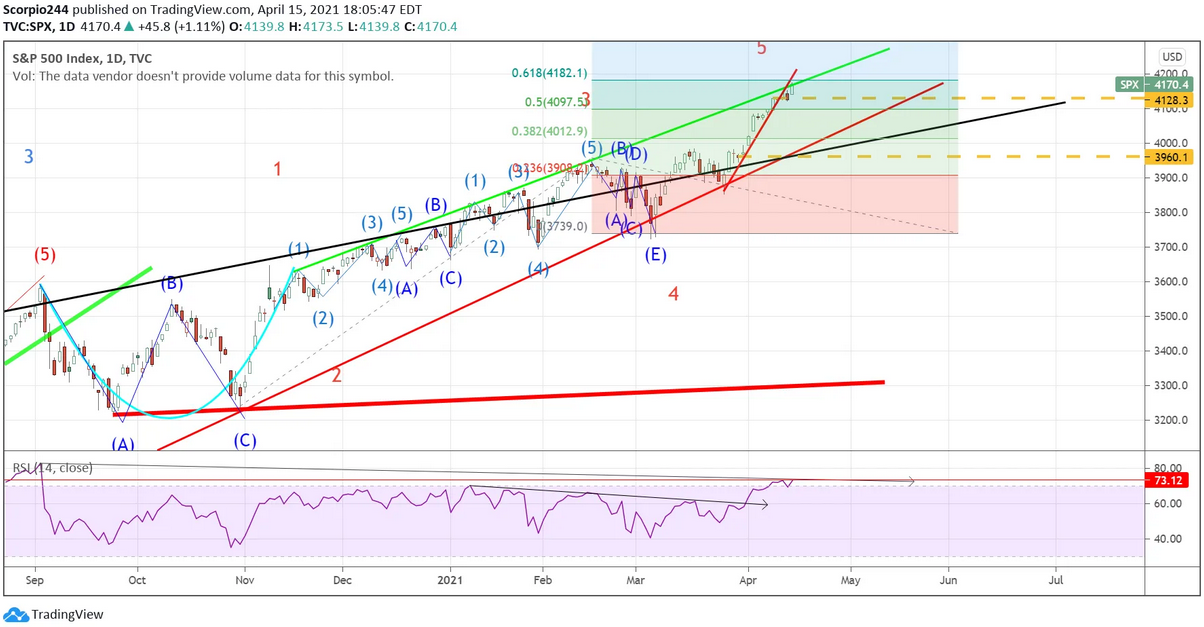
SPX Index Daily Chart

It was a strange day, in a sense, because the VIX fell, but the VVIX index was up again. This is a warning sign; pay attention to what it is telling you; it should not be ignored, nor should it be dismissed.
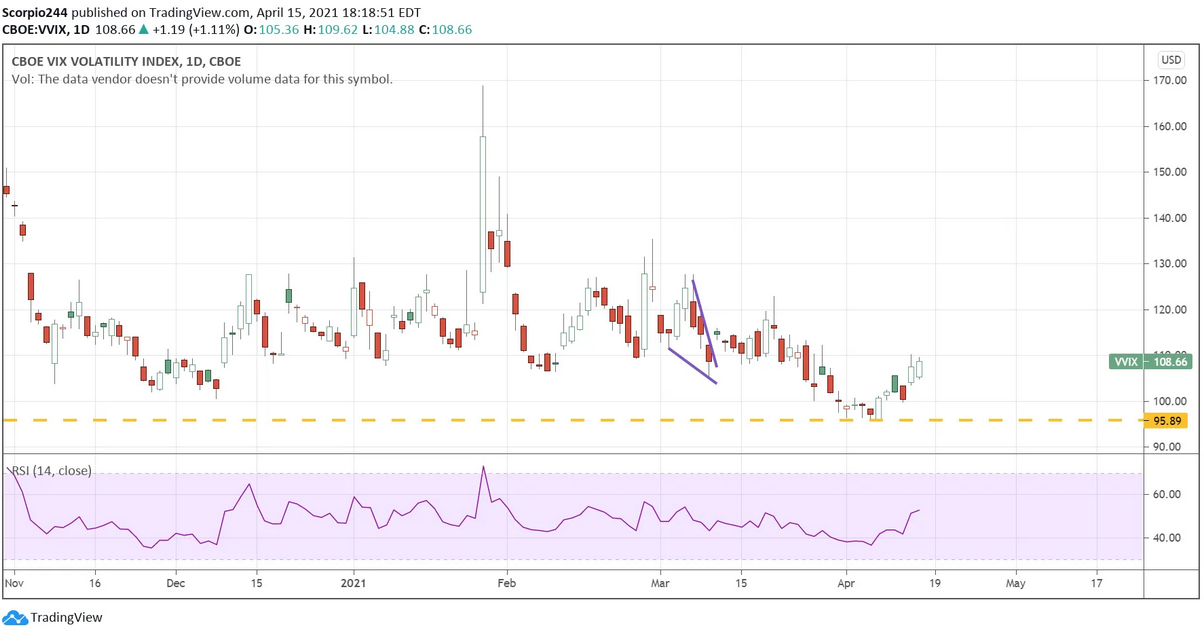
VIX Index Daily Chart

10-Year Treasury Note

The 10-year yield fell sharply today, closing at 1.57%. The 10-year found some decent support, around 1.51%, and managed to hold the lower trend line. Perhaps that is it for the move lower in yields.
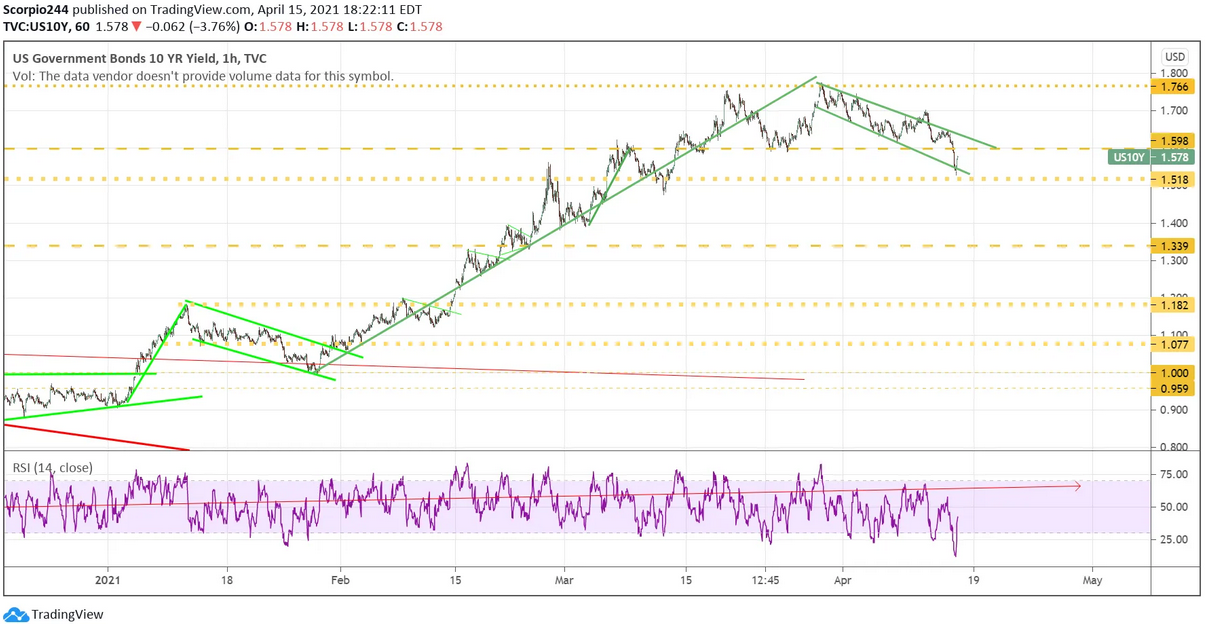
US 10 Yr Yield 1-Hr Chart

Taiwan Semiconductor

Taiwan Semiconductor (NYSE:TSM) did not have a good day and has not kept pace with the recent rally one bit. Perhaps it is sending a message, but again, this should not be ignored.
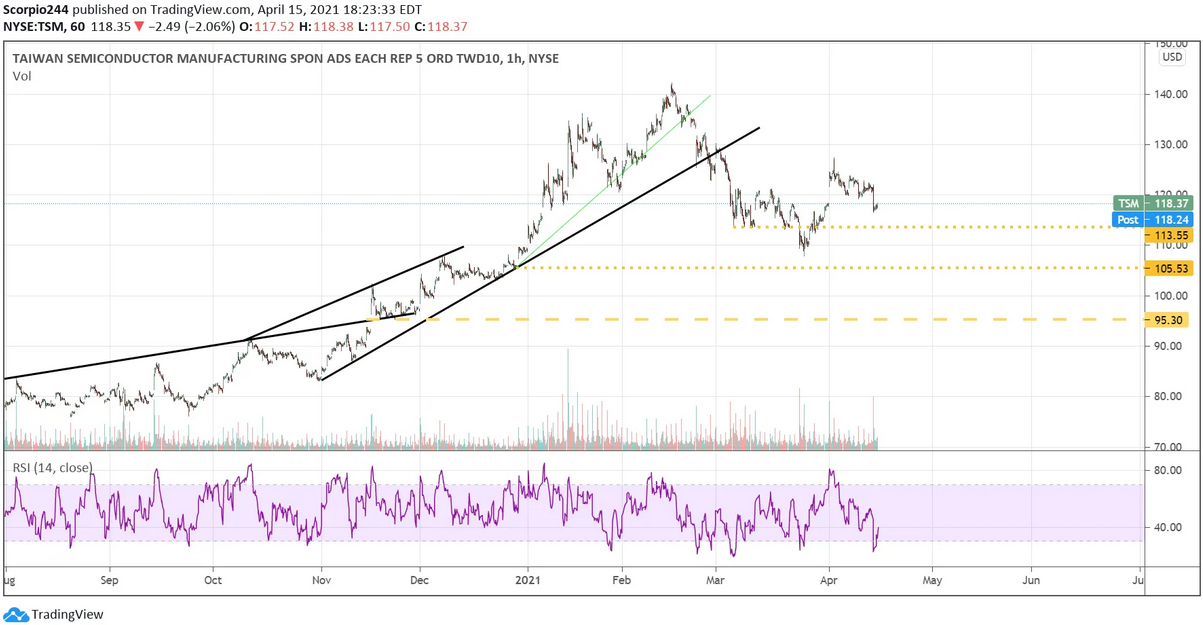
TSM Chart

Freeport

Freeport (NYSE:FCX) was up nicely today; as I noted yesterday, it had a bullish setup. The stock probably has some further to rise, perhaps to $39, as I mentioned yesterday as well.
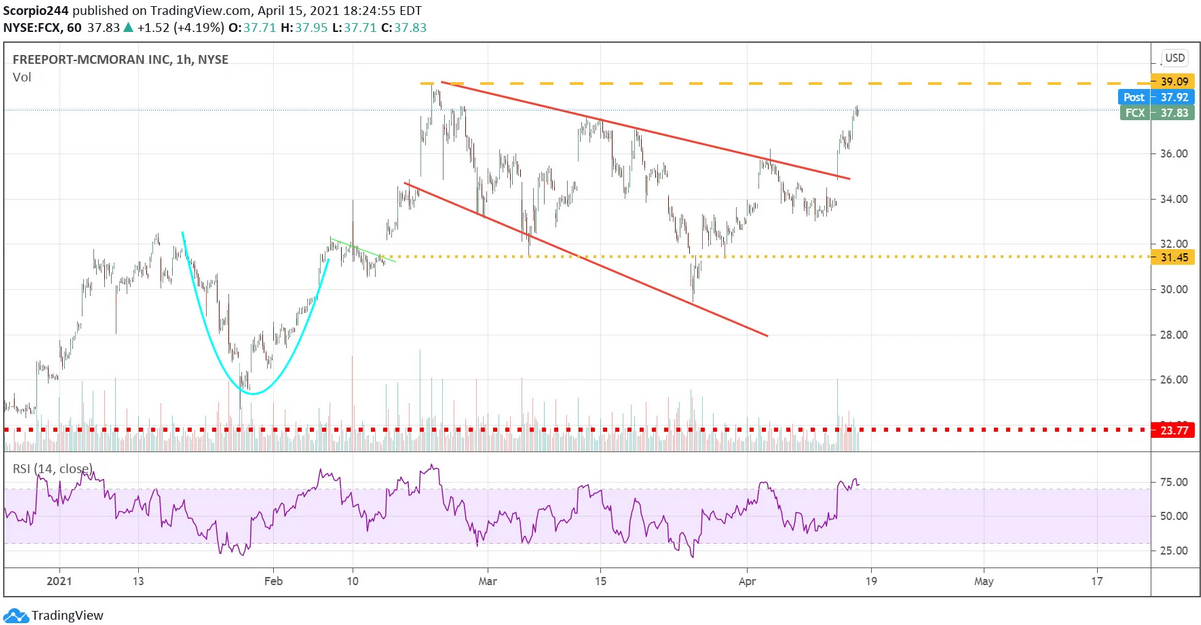
Freeport (FCX) 1-Hr Chart

Docusign

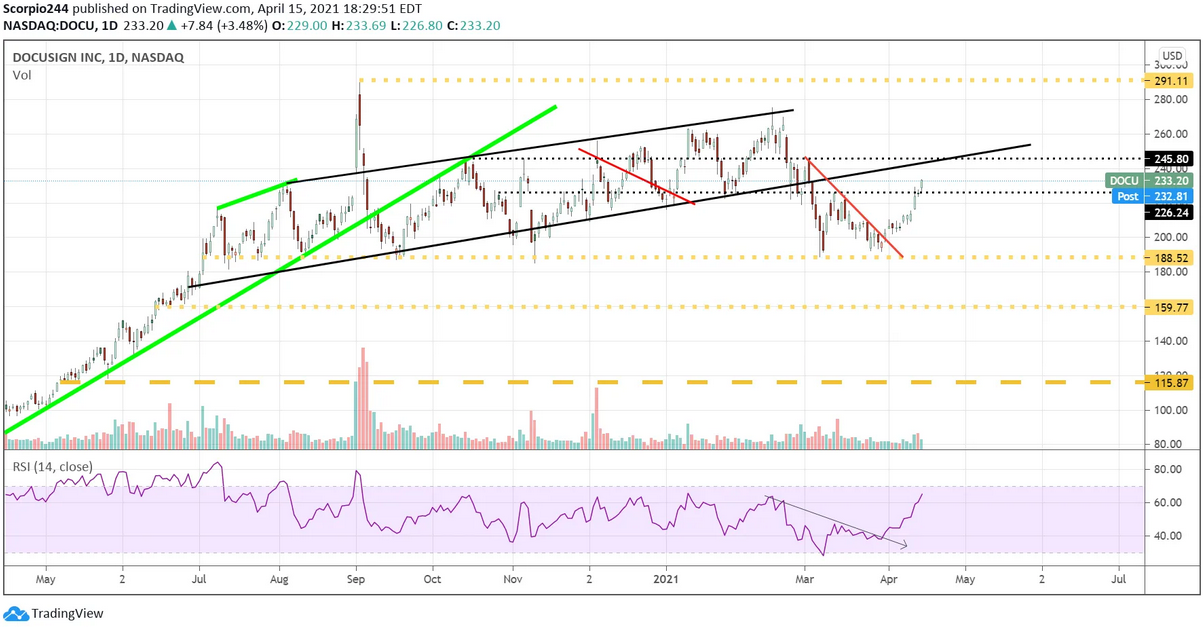
DocuSign (NASDAQ:DOCU) may have a little bit further to go before turning lower. The stock appears to be heading towards resistance around $246; I expect it to stall once it gets to that level.
3rd party Ad. Not an offer or recommendation by Investing.com. See disclosure here or remove ads .

DocuSign Daily Chart

Micron Technology

Micron (NASDAQ:MU) is back to trading poorly. The stock initially popped following results and then stalled out for the third time, around $96. I still contend it will fall back to $85; for now, $74 seems too much of a stretch.
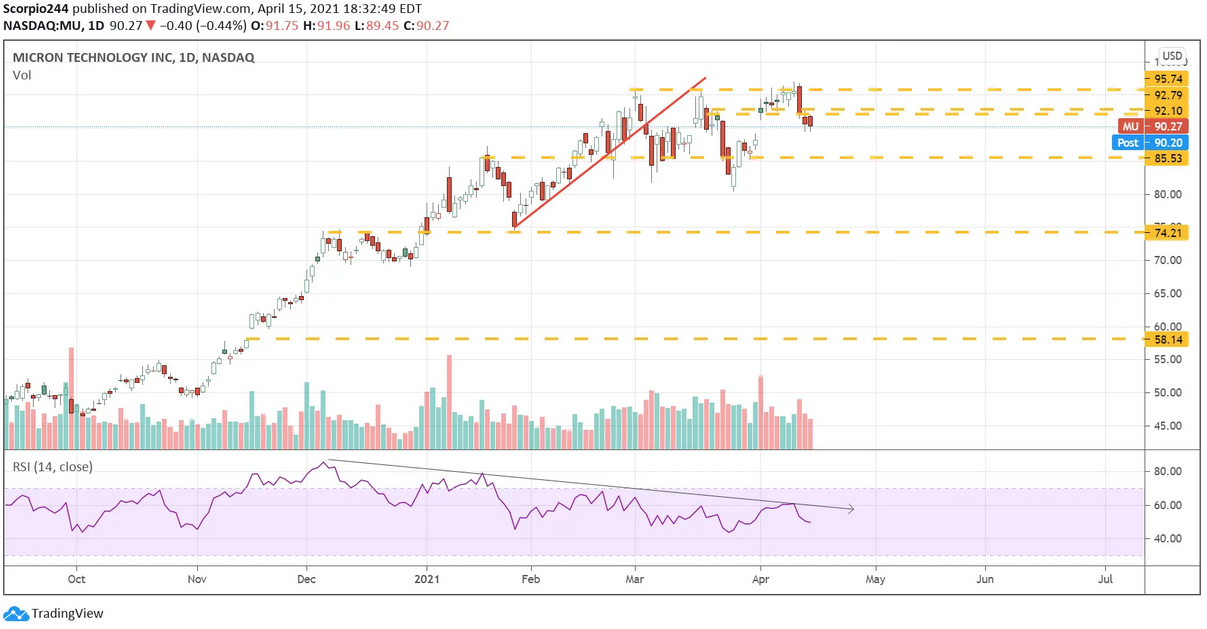
Micron Tech Inc Daily Chart

Bitcoin

Anyway, Bitcoin probably has a little bit further to climb. Based on a projection, I can get it up to 66,000, and that could be all she wrote for this one. Truthfully, I’m tired of hearing about Bitcoin. I don’t believe that Bitcoin is the future of anything because I don’t see how any government would allow this to become a legal tender form. Once a country does that, it would lose the power to control its currency and issue debt denominated in its own currency. Think about Greece in the middle of the European debt crisis. If they had not been part of the euro, they would have found it much easier to relieve many of their problems. Not to mention Bitcoin is subject to capital gains taxes. I see too many hurdles here. Maybe I’m not visionary enough, though.
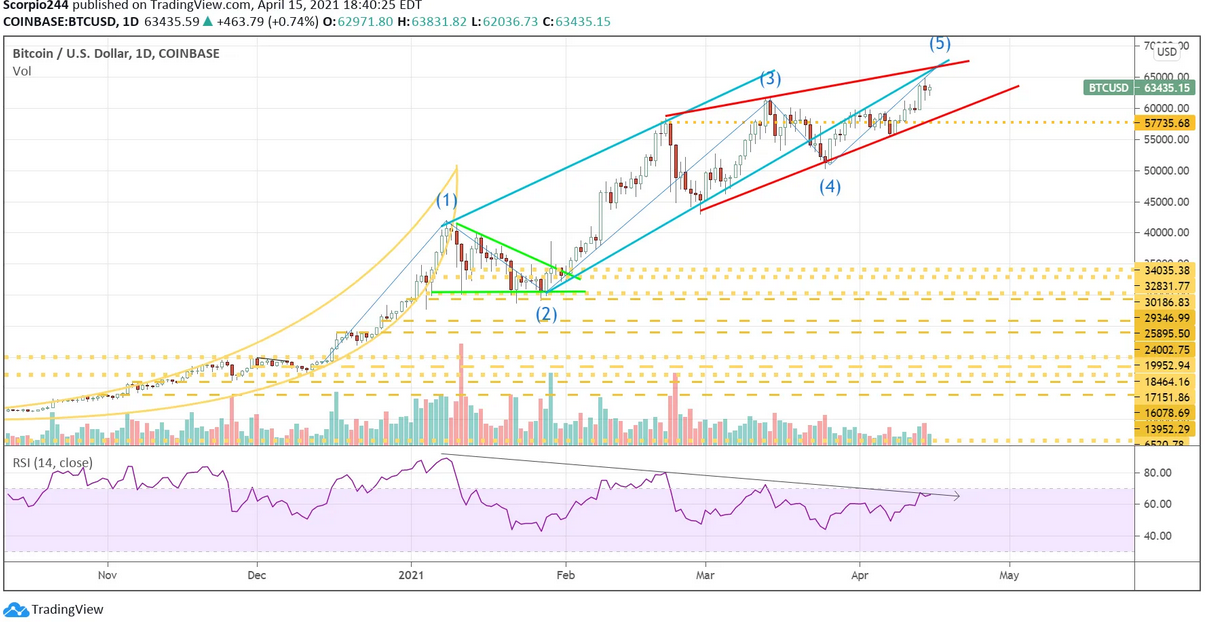
BTC/USD Daily Chart

Original Post

Latest comments

100% correct about the Greek case! Plus, Greece was not 'allowed' (nice way to say 'forced in a mafia-like tactics') to seek help outside EU. Anyway, I will agree too about BTC itself however I see a LOT of future in cryptocurrency generally
nvda has gotten outta control!
Risk Disclosure: Trading in financial instruments and/or cryptocurrencies involves high risks including the risk of losing some, or all, of your investment amount, and may not be suitable for all investors. Prices of cryptocurrencies are extremely volatile and may be affected by external factors such as financial, regulatory or political events. Trading on margin increases the financial risks.
Before deciding to trade in financial instrument or cryptocurrencies you should be fully informed of the risks and costs associated with trading the financial markets, carefully consider your investment objectives, level of experience, and risk appetite, and seek professional advice where needed.
Fusion Media would like to remind you that the data contained in this website is not necessarily real-time nor accurate. The data and prices on the website are not necessarily provided by any market or exchange, but may be provided by market makers, and so prices may not be accurate and may differ from the actual price at any given market, meaning prices are indicative and not appropriate for trading purposes. Fusion Media and any provider of the data contained in this website will not accept liability for any loss or damage as a result of your trading, or your reliance on the information contained within this website.
It is prohibited to use, store, reproduce, display, modify, transmit or distribute the data contained in this website without the explicit prior written permission of Fusion Media and/or the data provider. All intellectual property rights are reserved by the providers and/or the exchange providing the data contained in this website.
Fusion Media may be compensated by the advertisers that appear on the website, based on your interaction with the advertisements or advertisers.
© 2007-2024 - Fusion Media Limited. All Rights Reserved.