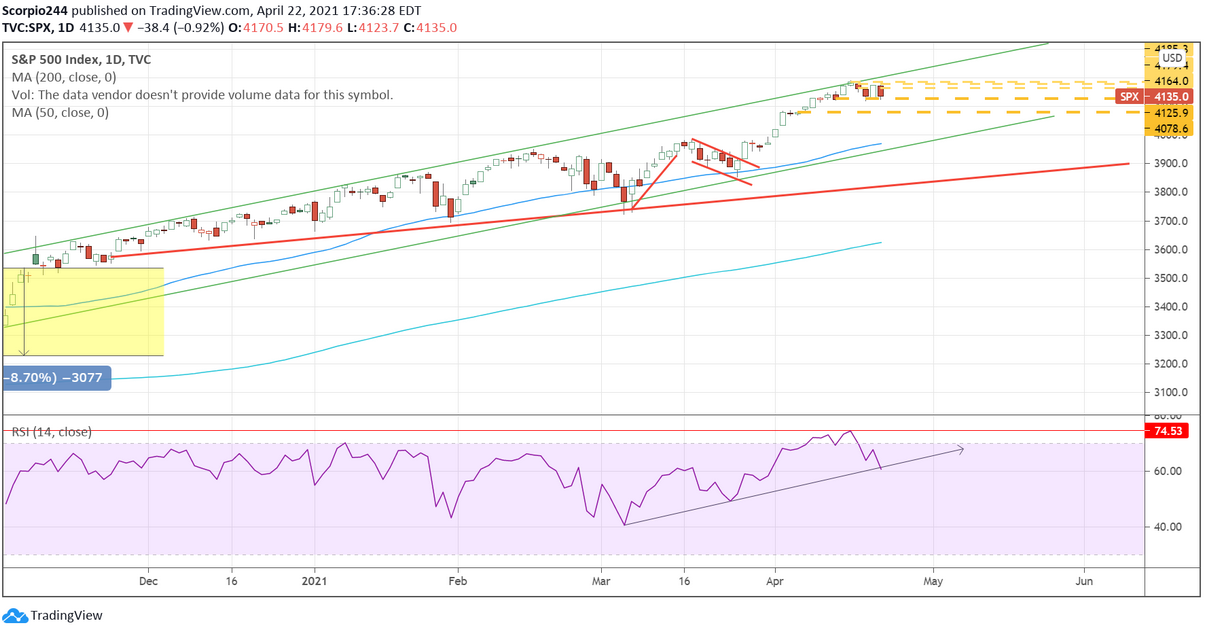
Stocks reversed sharply yesterday when they got to the base of the gap at 4,180 on the S&P 500. The news of a 40% long-term capital gains tax didn’t sit well with investors. Whether the tax is a reality or not, it woke the sellers up. Is this a trend changer? It could be. The one thing the markets hate is uncertainty, and something like a major change in tax policy around capital gains is a lot of uncertainty.
You can see the index hit the 4180 region right around 1 PM ET and fell like a stone. We didn’t learn much, though, with the S&P 500 falling back to support at 4,130. A break of 4,130 will set us for a drop to 4,080.
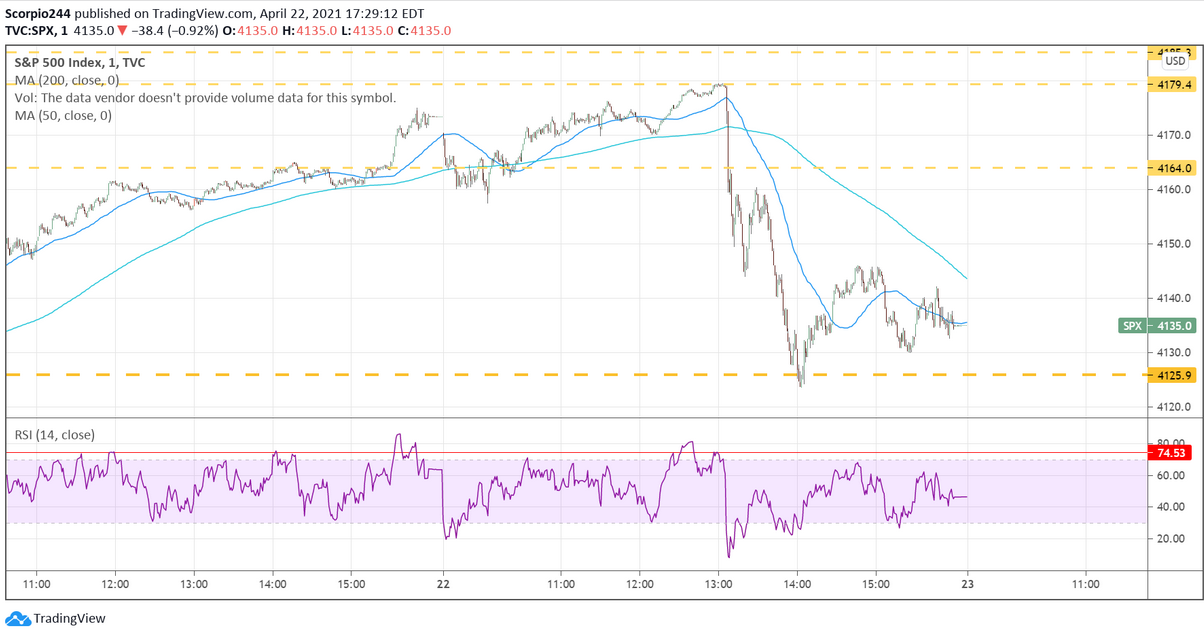
Additionally, there is now a potential break in the uptrend of the RSI, and that will indicate a change in trend; So I would not be surprised to see the S&P 500 retrace to 3,960, the same thing I have been saying for the past week and a half.
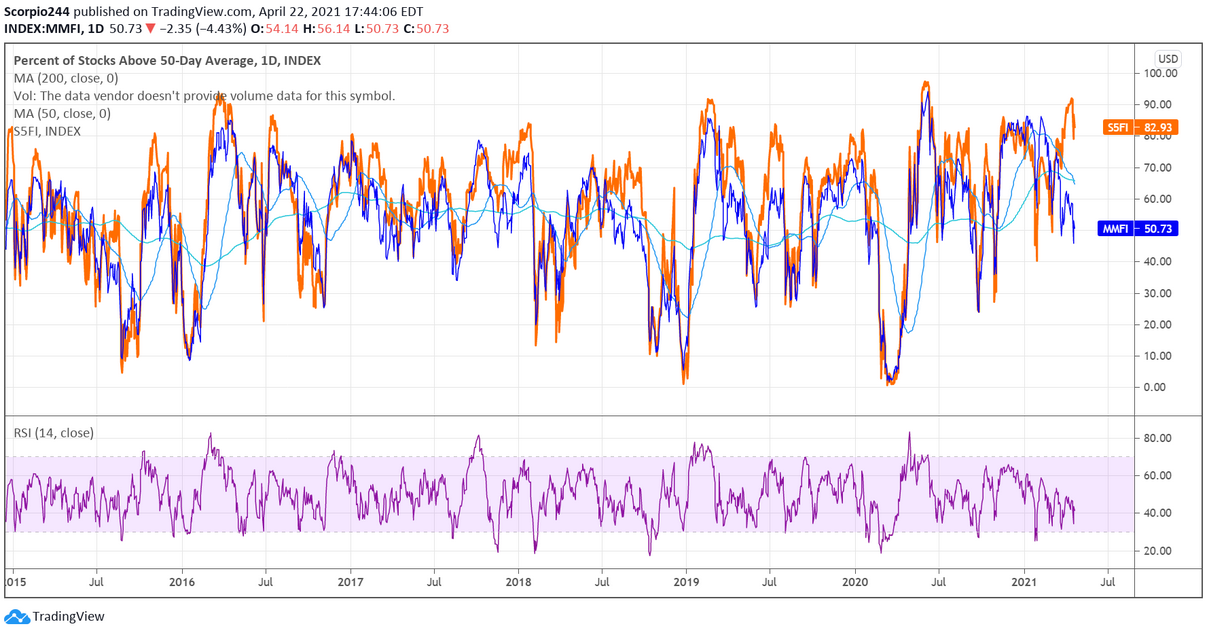
I think I pointed sometime last week the divergence between the number of stocks in the S&P 500 over their 50-day moving average and the number of total stocks above their 50-day. The difference is rather large. You could even say it is the largest divergence ever, well, at least on the data set in the chart below.
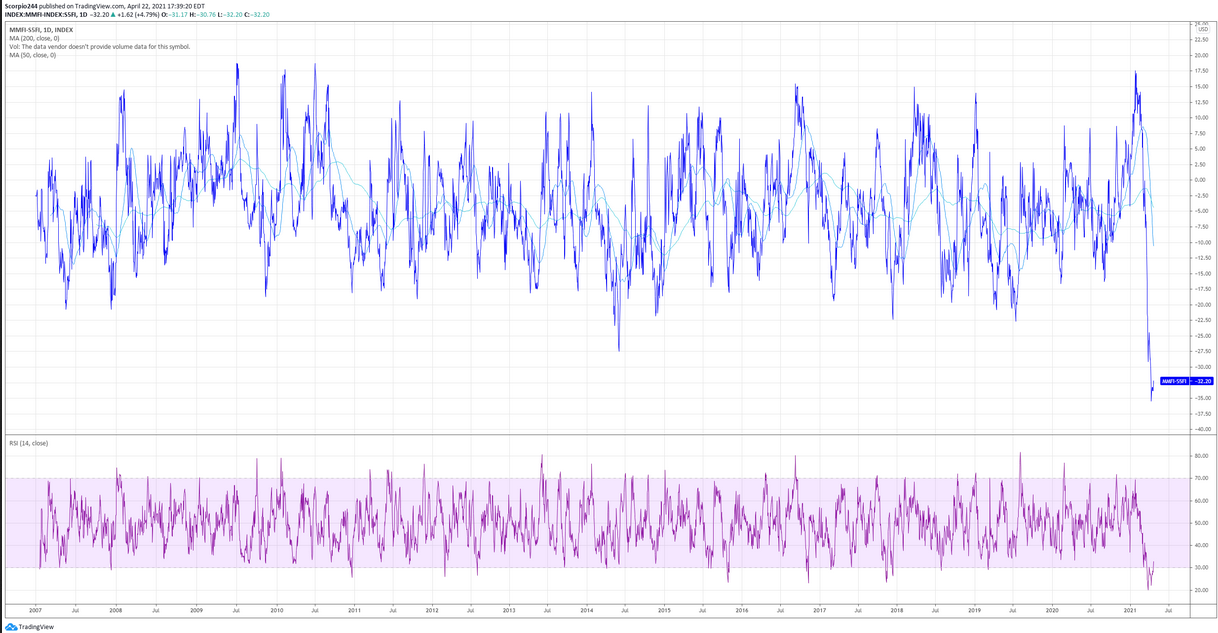
Now you could say, maybe that is a positive because all those poor little small-cap stocks need to catch up to the big bad large caps. Or you can look at from a more realistic standpoint and clearly see that the blue line (all stocks) have been trending lower for some time, while the orange line (S&P 500 stocks) have been moving higher, and that now the S&P 500 stocks needs to fall lower because they are coming off near record-high levels.
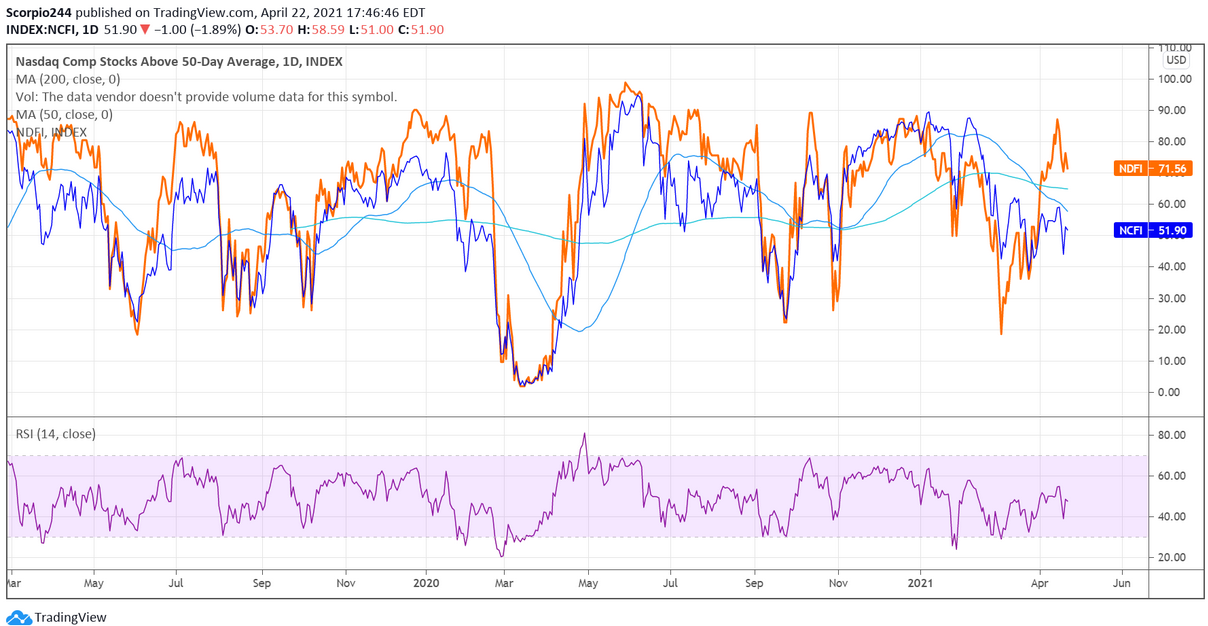
Interestingly, you see the same thing when comparing the Nasdaq Composite with the NASDAQ100, with the stocks in the COMP never recovering from their February sell-off.
Intel
Intel (NASDAQ:INTC) is sinking after hours; the 2Q guidance looked weak. I’m not surprised it is falling tonight; I noted it might fall last week after the results. 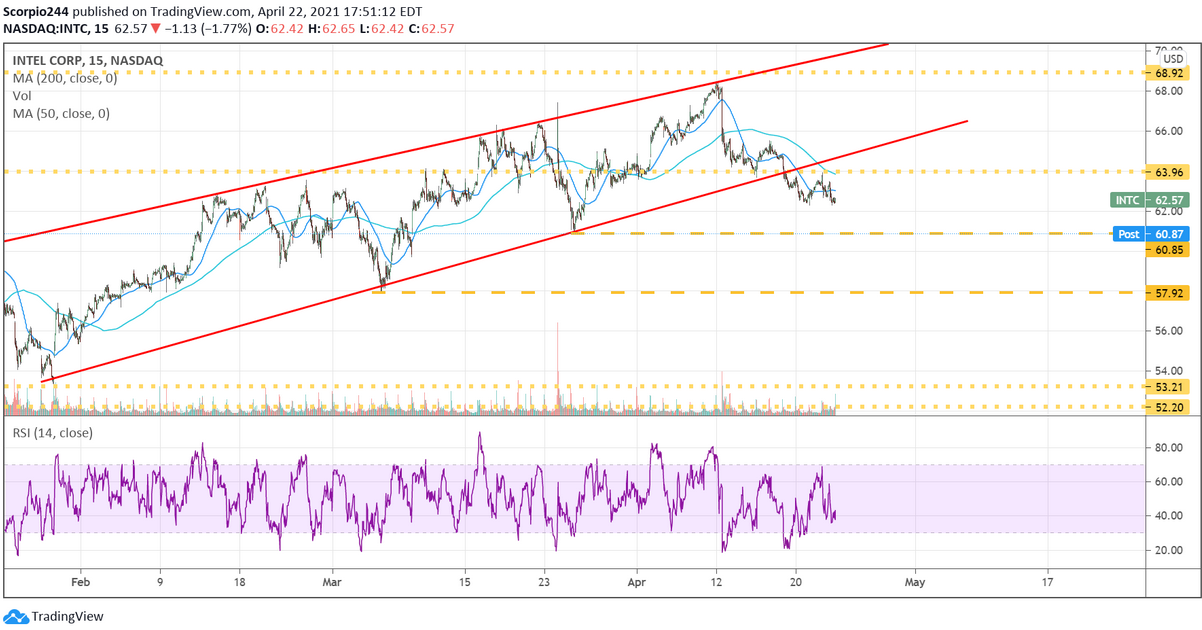
AT&T
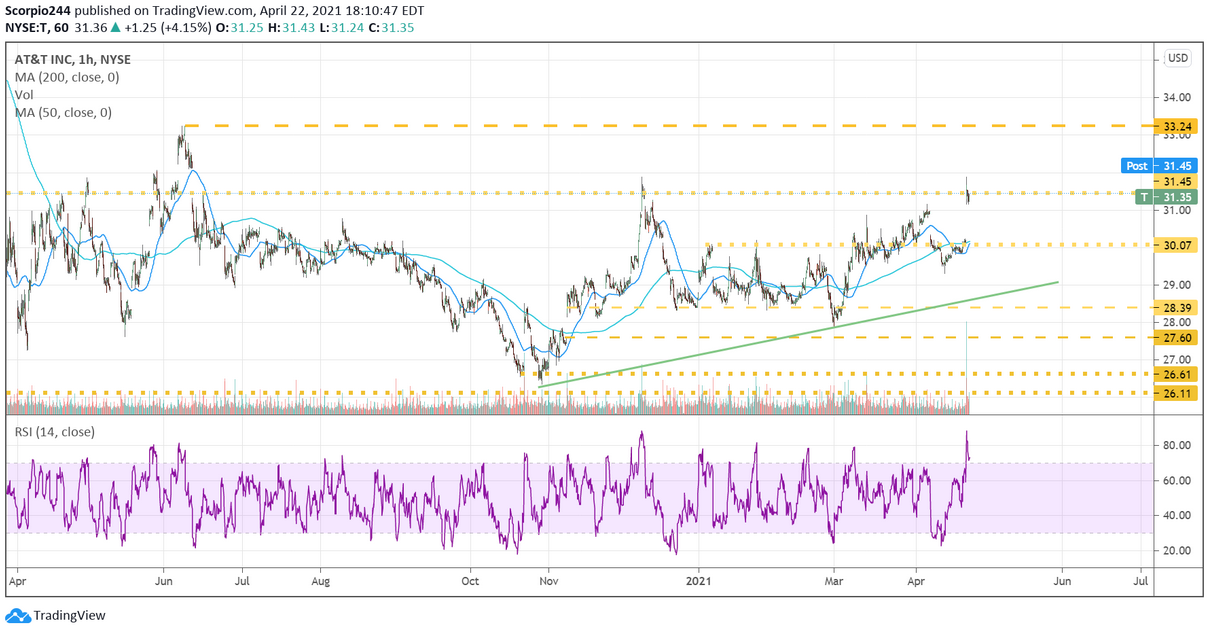
AT&T(NYSE:T) actually went up yesterday. It looks like the bar was set low enough that they were able to beat them when they reported results. The stock actually even got back to $31.35.
Micron
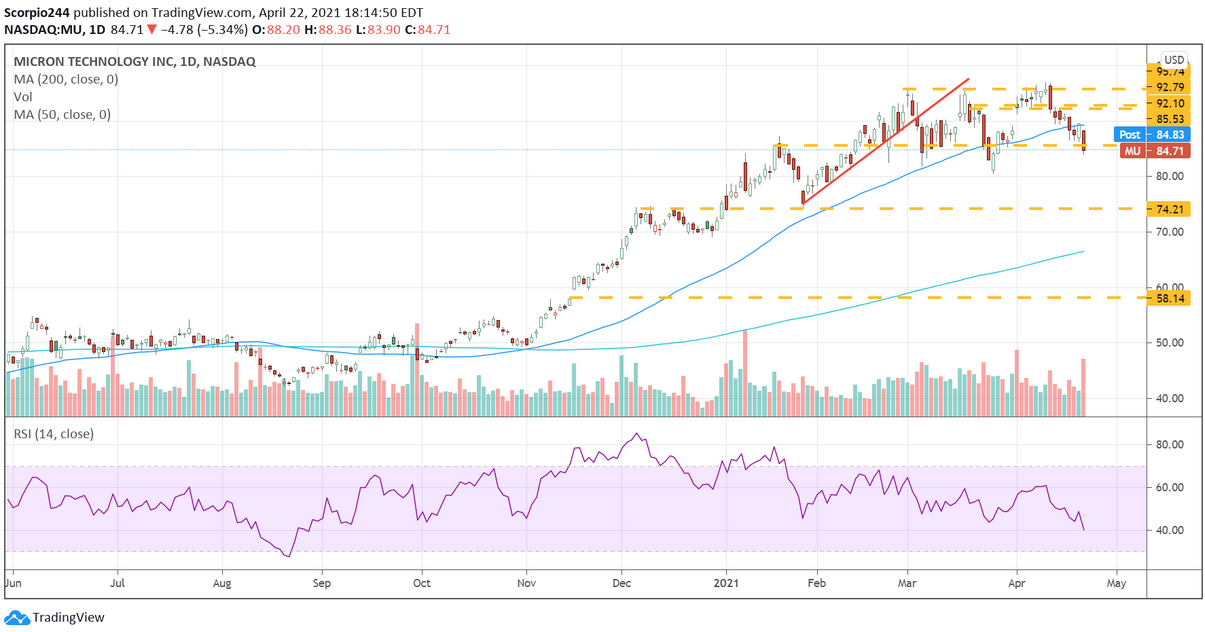
Micron (NASDAQ:MU) continues to fall, down another 4%, back to support around $85. This time I think it breaks and goes lower to $74. They just reported good results and gave good guidance; the stock trades horrible, though, which means something. Not to mention that the RSI is screaming for lower prices.
Bitcoin
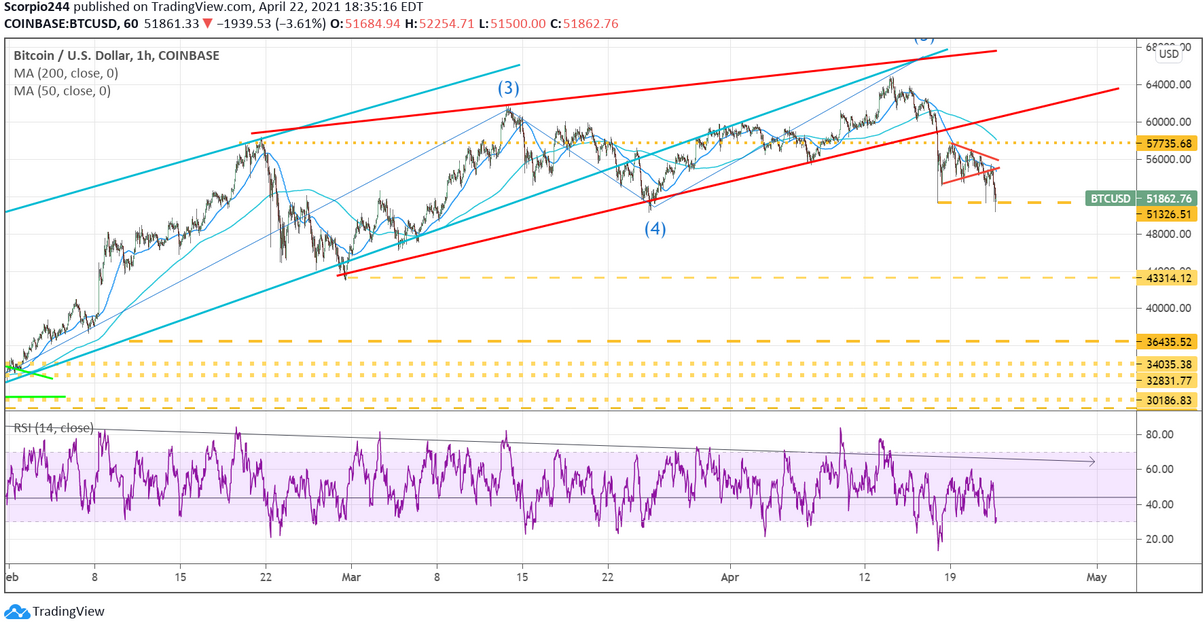
Bitcoin is breaking down and is now at the 51,800 level. A break here, and we could be talking about 43,000 next.
