Get 40% Off
👀 👁 🧿 All eyes on Biogen, up +4,56% after posting earnings. Our AI picked it in March 2024.
Which stocks will surge next?
Unlock AI-picked Stocks

Stock’s Drop Sharply In End Of Day Meltdown

Published 05/19/2021, 12:47 AM
Updated 09/20/2023, 06:34 AM

Stocks finished the day Tuesday lower, with the S&P 500 declining by around 80 bps and the Invesco QQQ Trust (NASDAQ:QQQ)s finishing down about 70 bps.

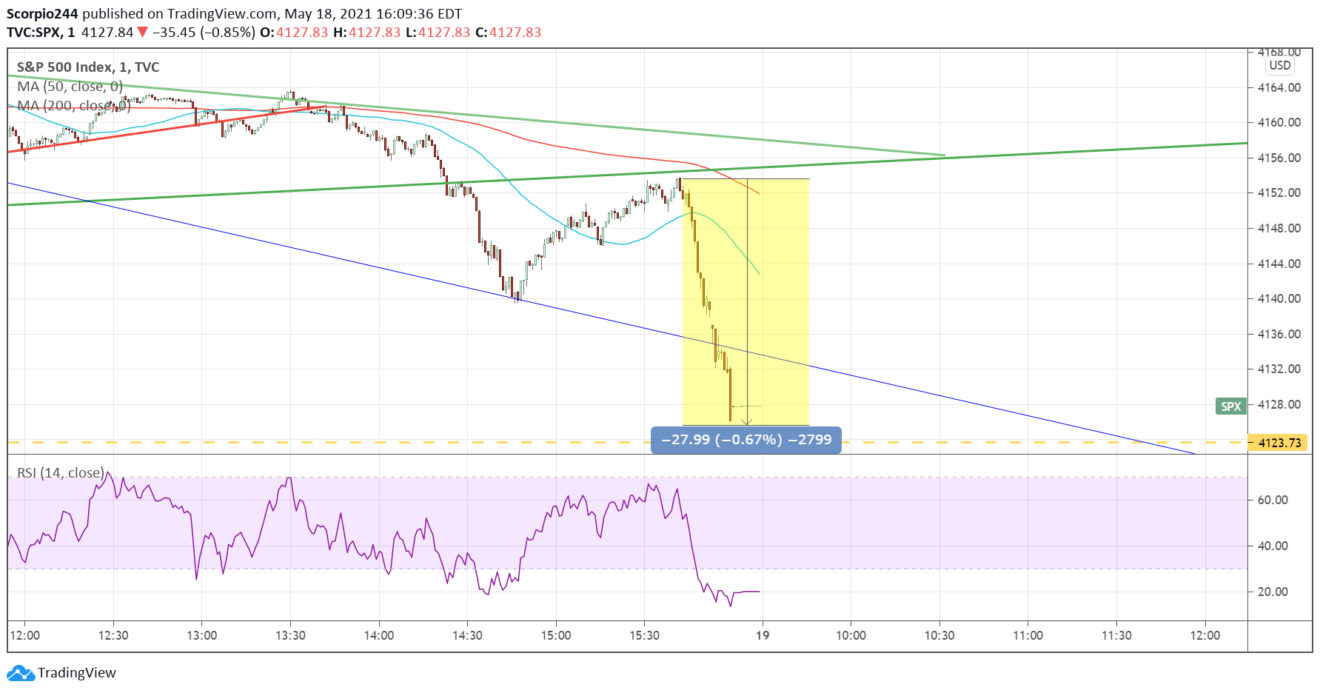
It was a tranquil day until 3:40, and then the market just took a pounding, ahead of a $1.3 billion sell imbalance going into the final 10 minutes. The S&P 500 dropped almost 70 bps in that time.

SPX Chart

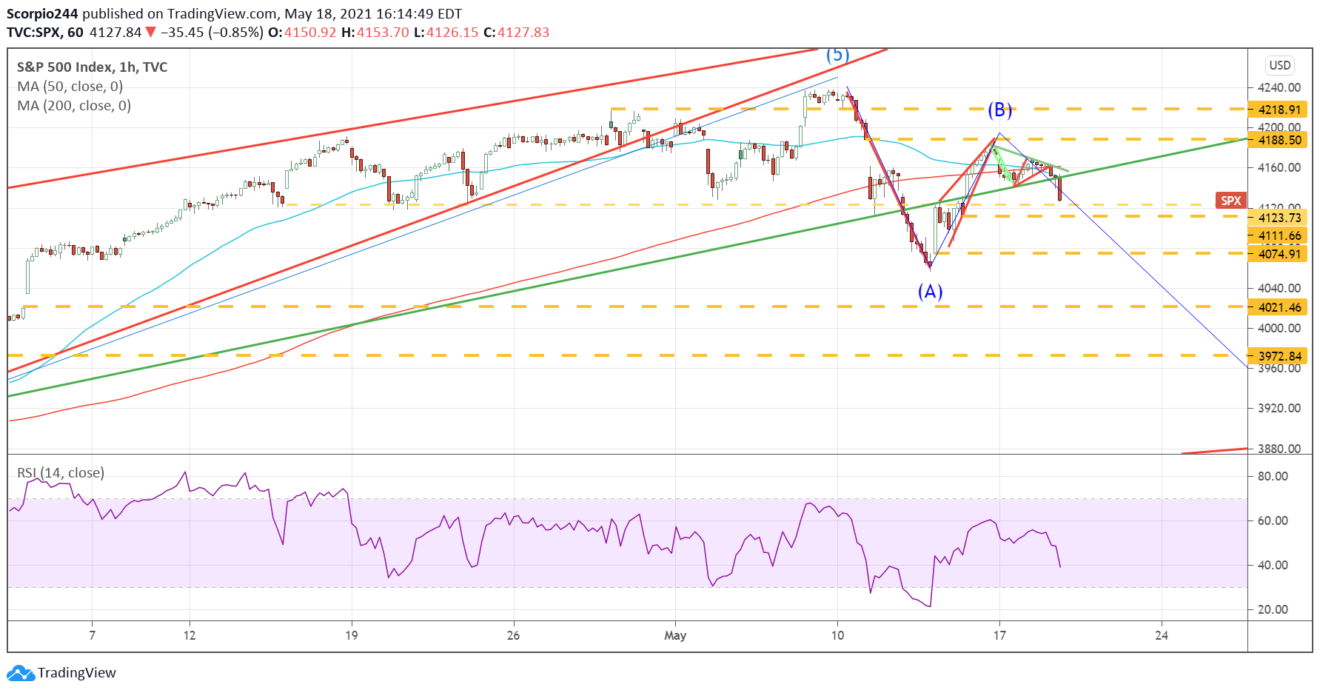
The big thing on Tuesday was the index falling below the March 2020 uptrend again. I think this is a big negative and likely to see more follow-through lower today.

You can see in the chart that we fell below that trend line around 2:30 and then snapped higher, retesting it. Once it failed, it would be lights out for the index, which is why I think we'll see more selling pressure today.

SPX 1-Hr Chart

Russell 2000

Additionally, the Russell 2000 looked fragile, with a big broadening wedge pattern that failed at the worst possible time. This does not bode well for the small-cap index.
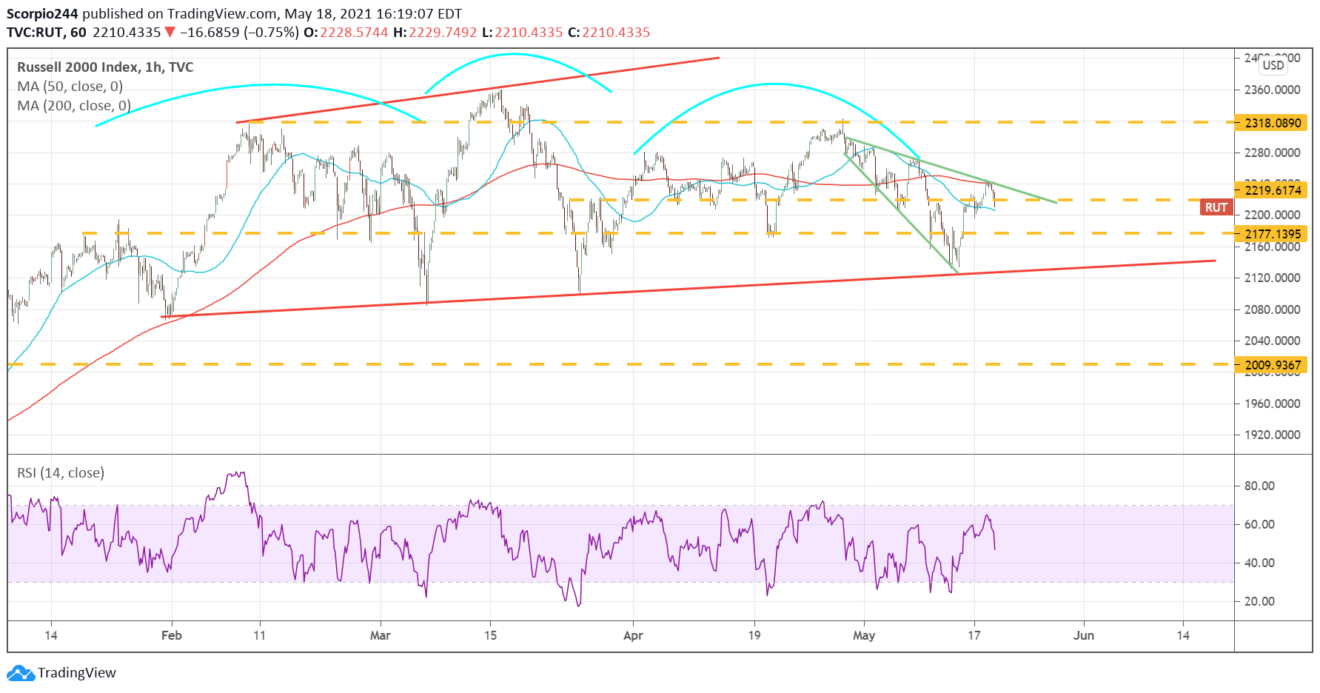
Russell 2000 Index 1-Hr Chart

Square

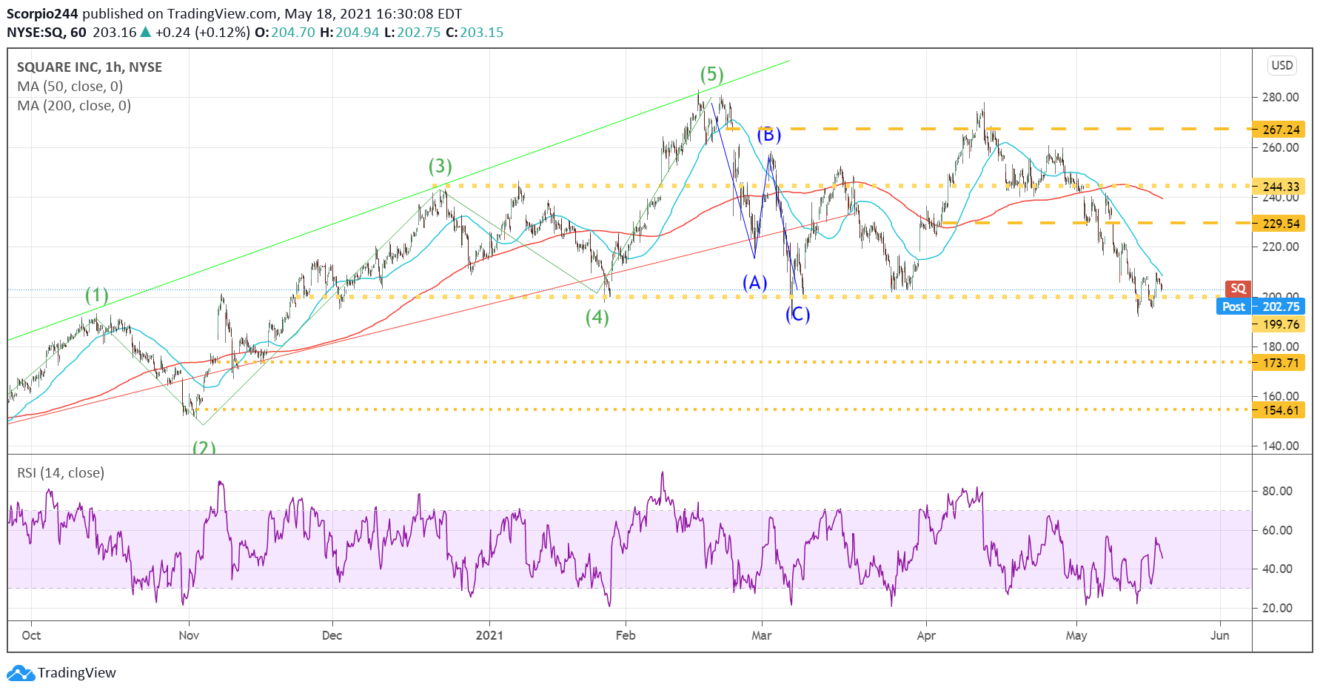
It seemed like Square (NYSE:SQ) was still melting. The stock was up more than 3%, yet it managed to finish flat on the day. Maybe it was just a pause in the melting, but once support at $200 breaks, it should result in a decline to $173.

Square (SQ) 1-Hr Chart

Amazon

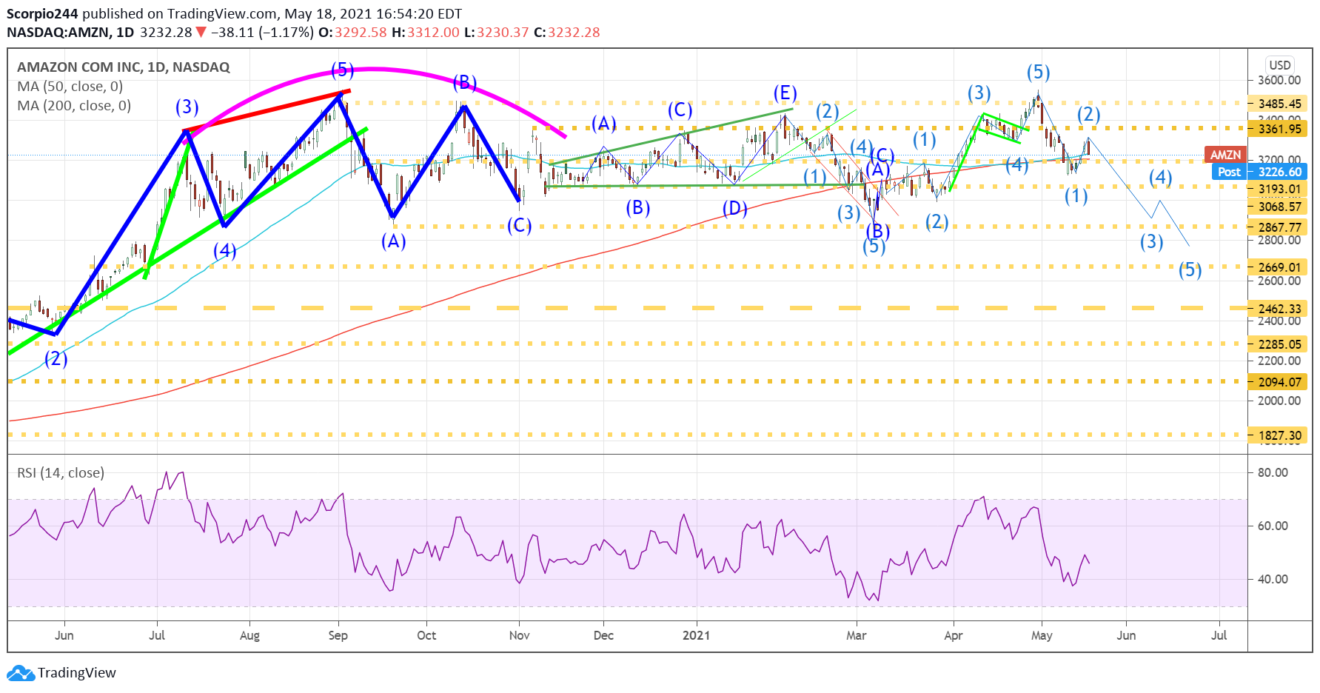
I’m messing around with this idea that Amazon.com (NASDAQ:AMZN) has completed its first wave lower and that we are just about finishing up wave 2. If that is the case, the next leg lower could be a decent size drop, pushing the stock down to 2,870.

3rd party Ad. Not an offer or recommendation by Investing.com. See disclosure here or remove ads .

Amazon (AMZN) Daily Chart

Home Depot

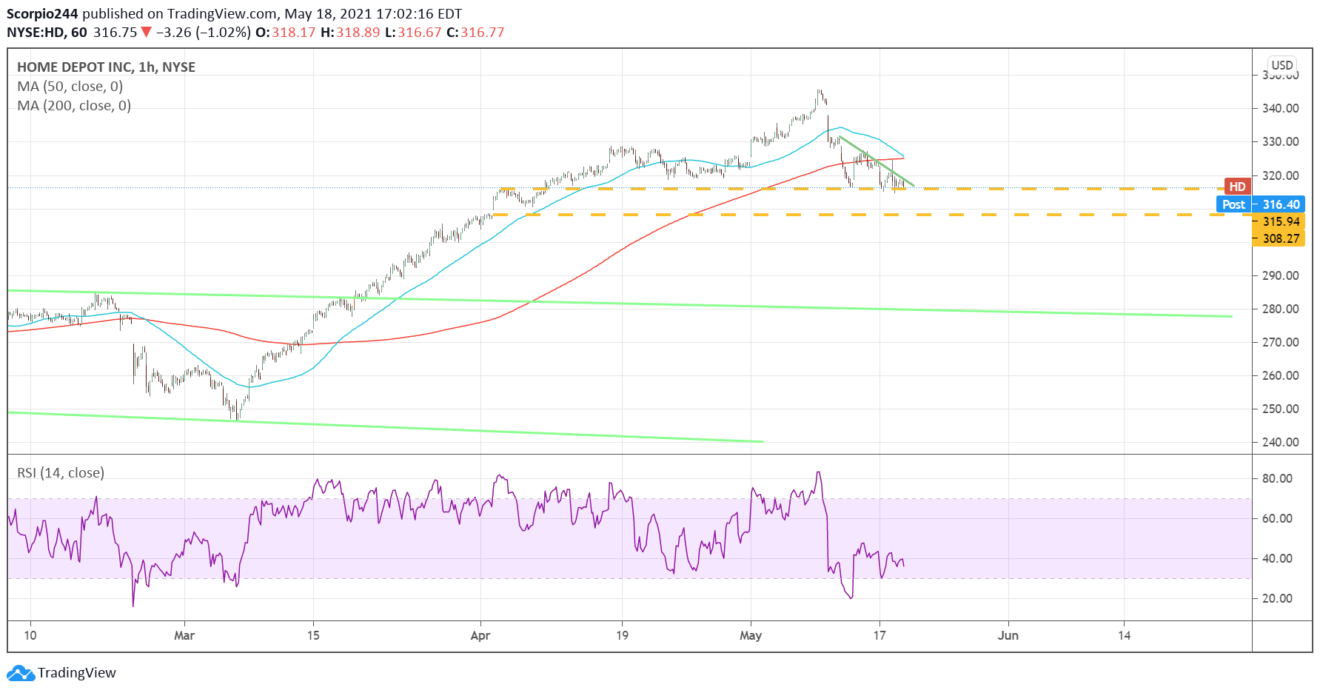
The chart for Home Depot (NYSE:HD) didn't look good at all, sitting on major support at $316. Once that support level breaks, long holders better hope that $308 doesn’t crumble. If it does, there is a long-very long way down.

Home Depot (HD) 1-Hr Chart

Lumber

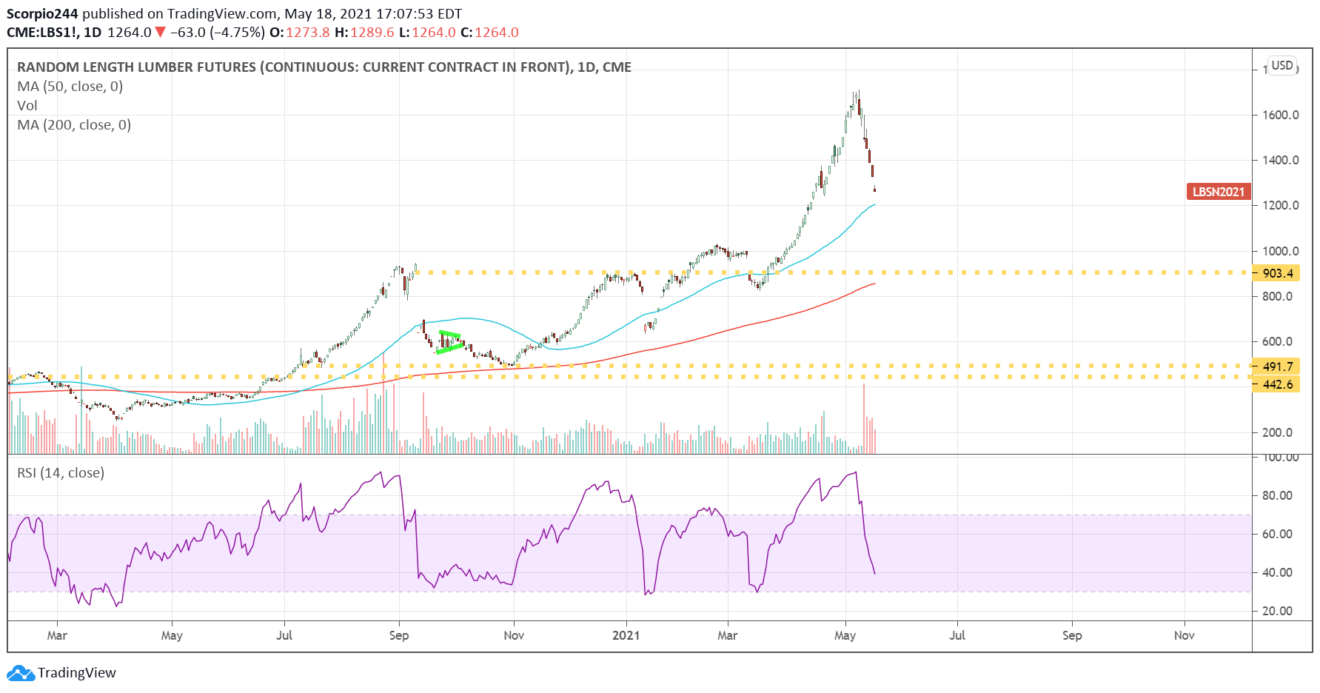
Lumber reminds me a lot of when I use to trade in exotic parts of the world, like Sri Lanka or Kenya. Lumber has that feel to it, thin markets; everyone knows a big buyer or seller is in the market. Lumber is a thin market, no doubt, but if the 50-day moving average does not hold, then the decline will likely continue.

Somebody wants out and is having a tough time. Reminds me of Pakistan in 2009. Every day the market would open for 15 minutes, and as soon as the main index was down 5% or something to that effect, the exchange would close for the day. Trying to sell in that type of environment isn’t easy.

Lumber Daily Chart

Zoom Video

Zoom Video (NASDAQ:ZM) was back over $300. The only problem was that the stock appeared to be facing a strong level of resistance, around $325.
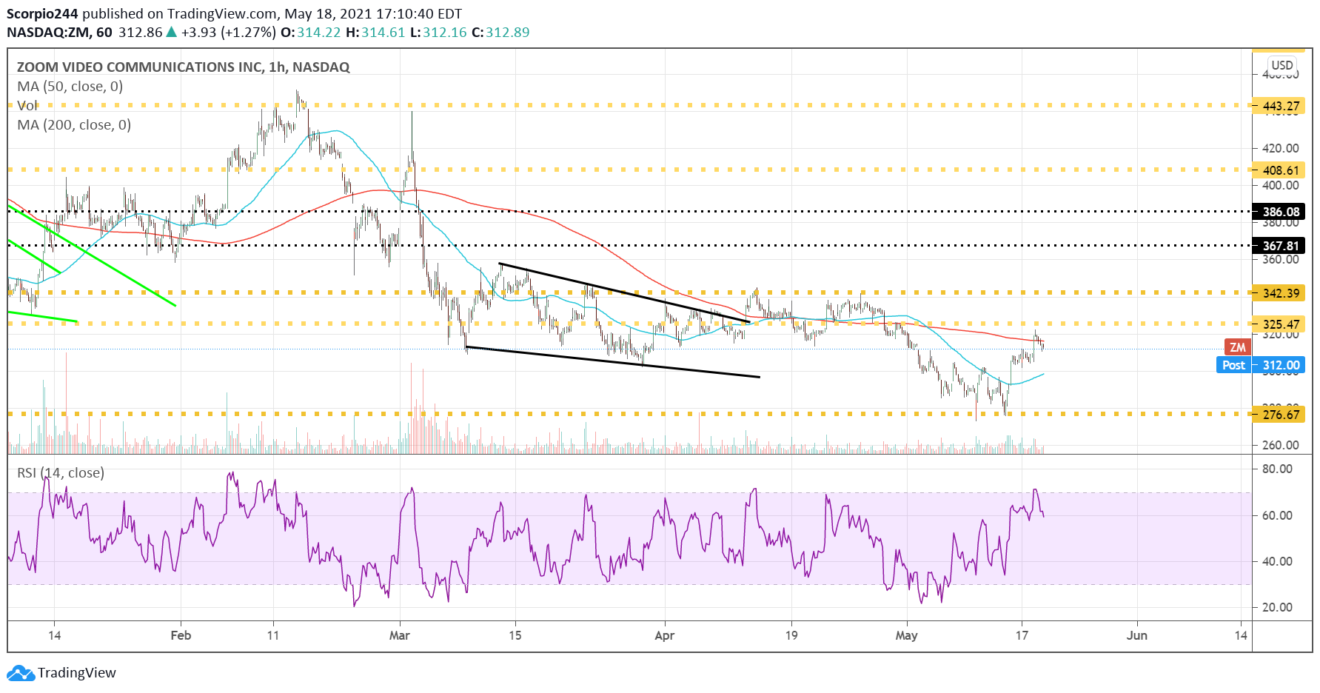
Zoom Video Daily Chart

Original Post

Latest comments

Thank you, Michael.
you are one of the few legit analyst on the web!
Risk Disclosure: Trading in financial instruments and/or cryptocurrencies involves high risks including the risk of losing some, or all, of your investment amount, and may not be suitable for all investors. Prices of cryptocurrencies are extremely volatile and may be affected by external factors such as financial, regulatory or political events. Trading on margin increases the financial risks.
Before deciding to trade in financial instrument or cryptocurrencies you should be fully informed of the risks and costs associated with trading the financial markets, carefully consider your investment objectives, level of experience, and risk appetite, and seek professional advice where needed.
Fusion Media would like to remind you that the data contained in this website is not necessarily real-time nor accurate. The data and prices on the website are not necessarily provided by any market or exchange, but may be provided by market makers, and so prices may not be accurate and may differ from the actual price at any given market, meaning prices are indicative and not appropriate for trading purposes. Fusion Media and any provider of the data contained in this website will not accept liability for any loss or damage as a result of your trading, or your reliance on the information contained within this website.
It is prohibited to use, store, reproduce, display, modify, transmit or distribute the data contained in this website without the explicit prior written permission of Fusion Media and/or the data provider. All intellectual property rights are reserved by the providers and/or the exchange providing the data contained in this website.
Fusion Media may be compensated by the advertisers that appear on the website, based on your interaction with the advertisements or advertisers.
© 2007-2024 - Fusion Media Limited. All Rights Reserved.