It was a boring day on the surface, but beneath it, it was anything but. lumber fell by 4.5%, and Bitcoin was briefly trading below 42,000. But the S&P 500 traded lower by just 26 bps, while the Q)s finished the day lower by about 60 bps. It had been worse, but the market got a boost towards the end of the day.
S&P 500
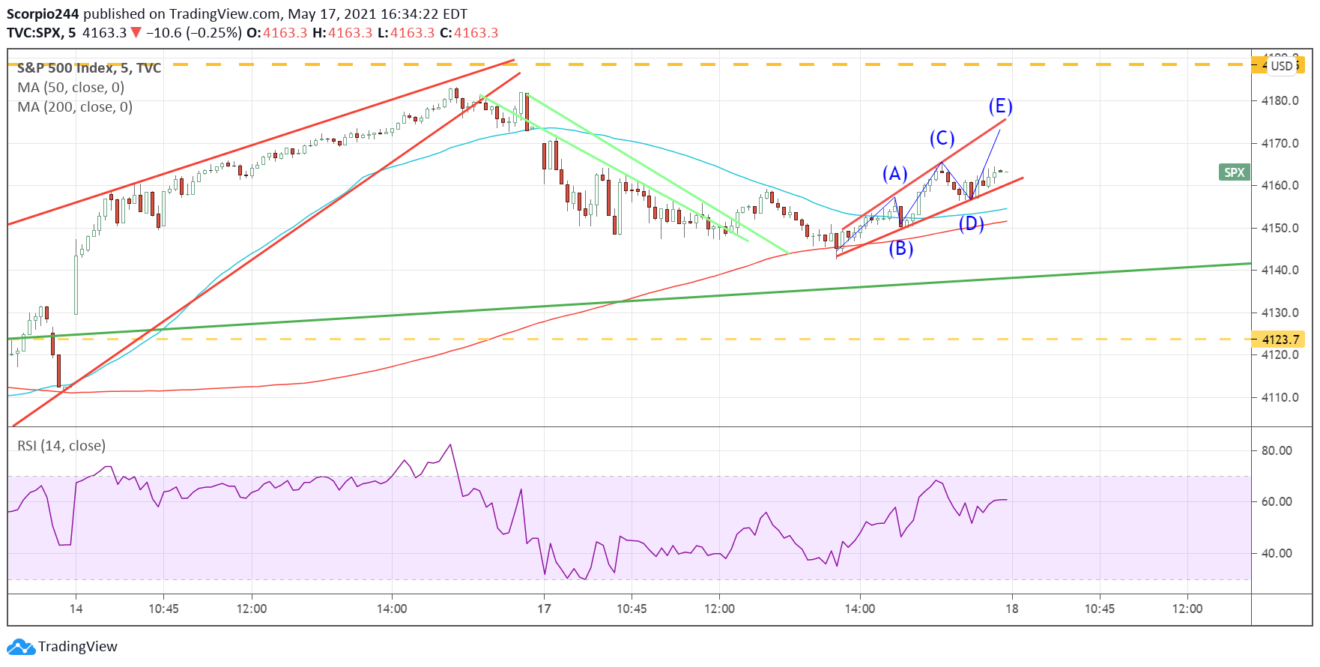
It seems possible that the equity market makes a run-higher tomorrow in an attempt to fill that gap up at 4,188 created from today’s opening. There is a nice broadening wedge that has formed in the SPY. This appears to be a bearish formation, resulting in the index trading lower after the move higher.
NASDAQ
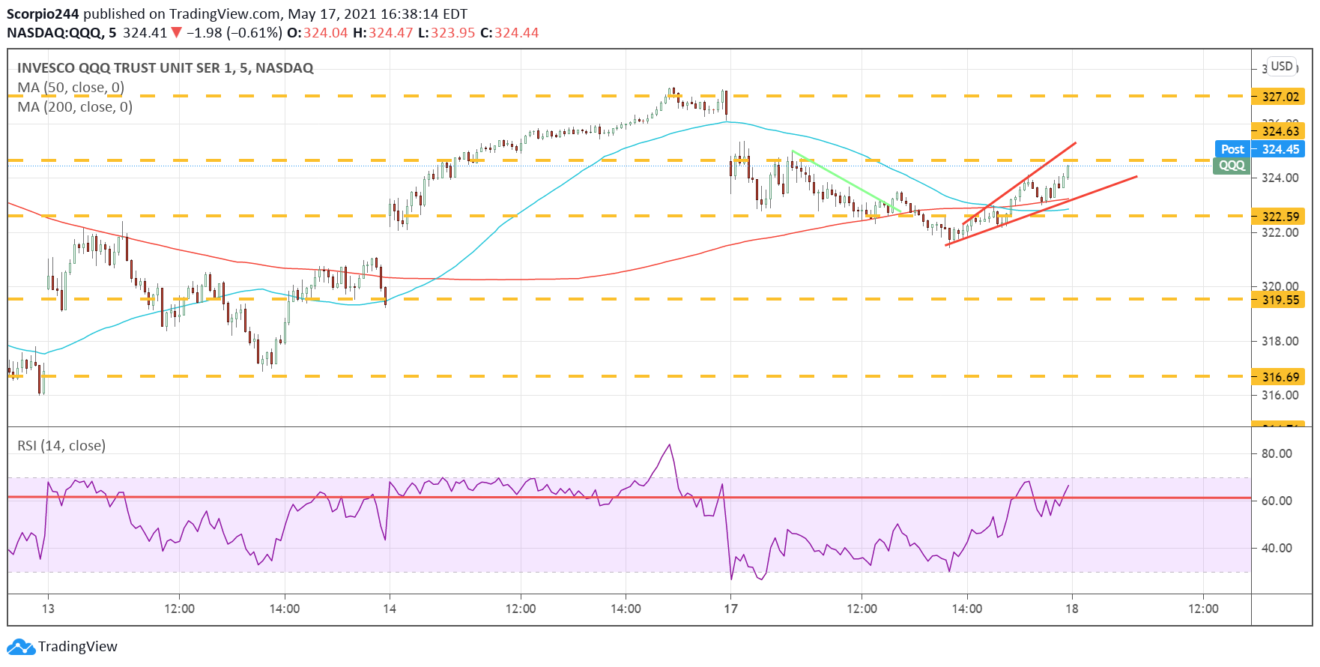
The same pattern is present in the Qs. However, this could change to some degree overnight because the patterns are also present in the futures and will continue to play out in the over nigh trading session.
S&P 500 Futures
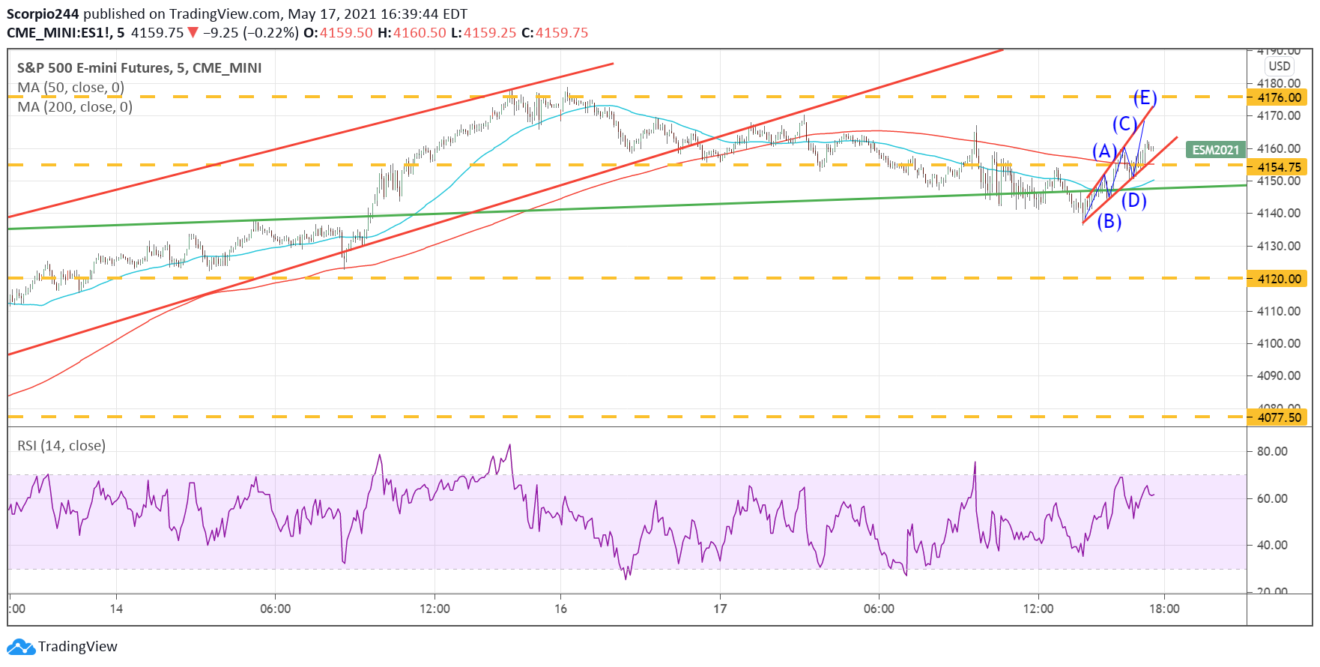
The pattern is also in the S&P 500 futures. It doesn’t have to go all the way up to the E to complete the pattern; at this point, a simple breaking of the “B” and “D” uptrend will be enough.
Lumber
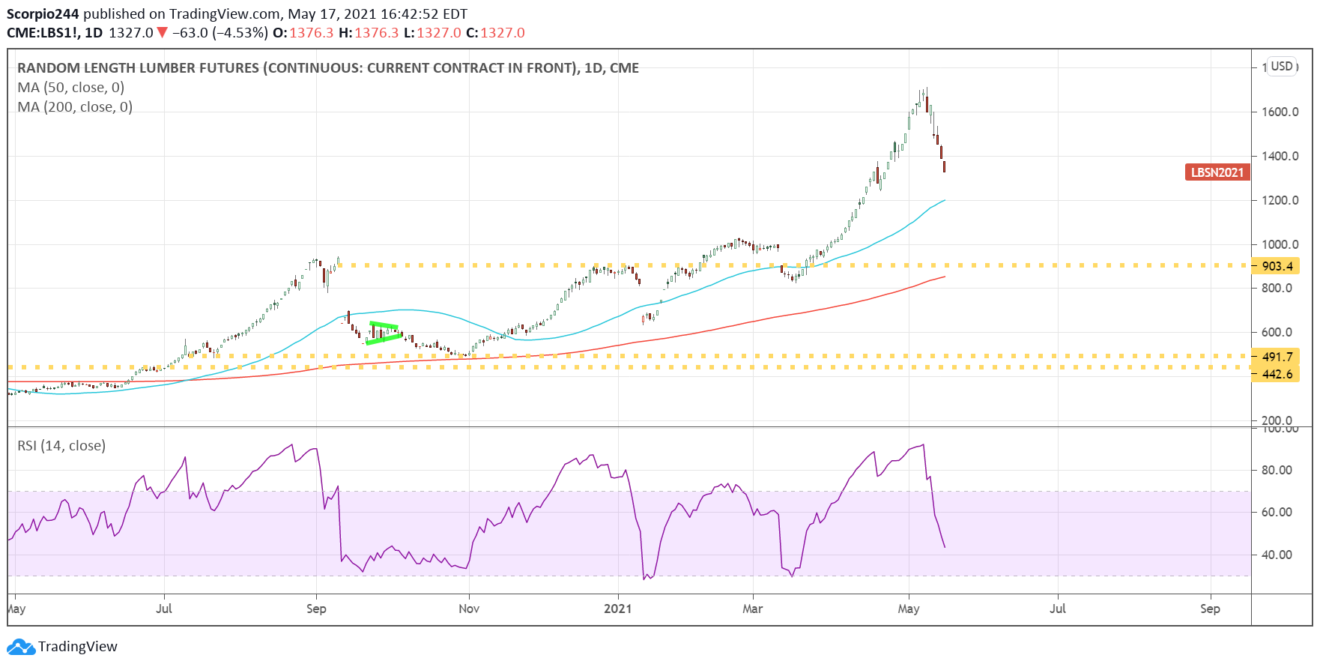
Meanwhile, lumber could continue to fall. The 50-day moving average has offered support in the past, and that is another 10% down from Monday’s close.
Why do we care about lumber? Because both lumber and Bitcoin are melting together, we care about these because we care about the Russell 2000 and because it tells us about the state of the stock market.
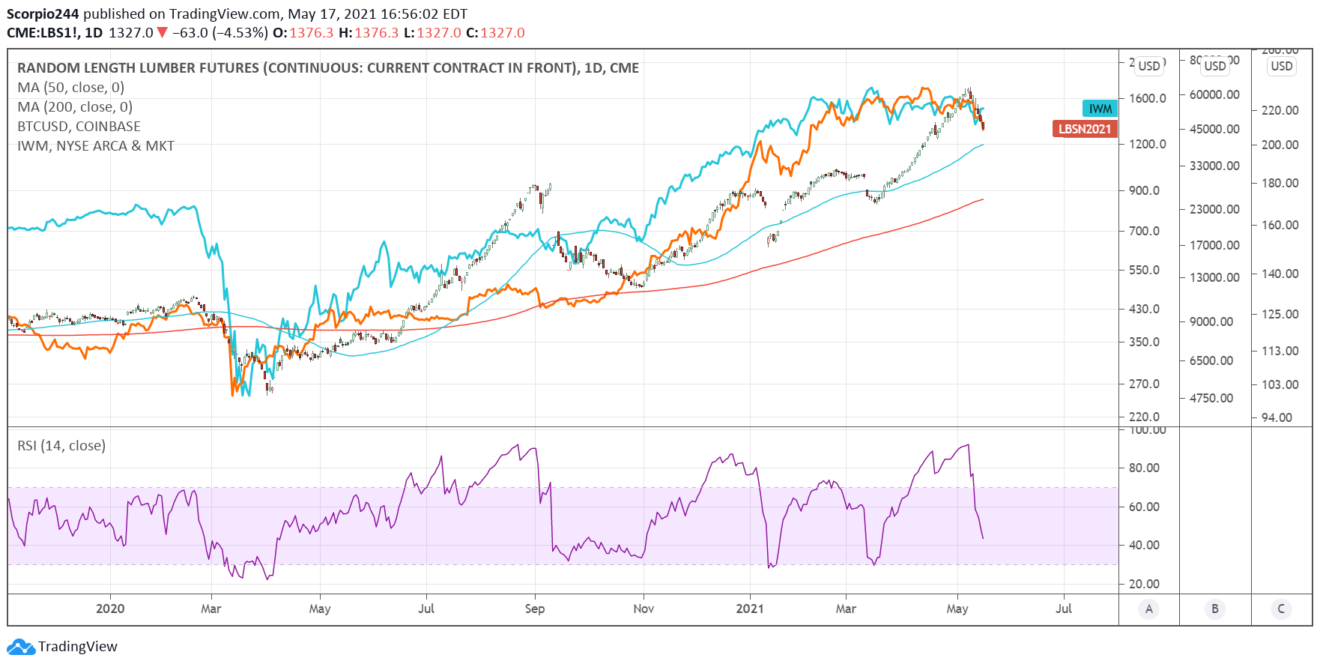
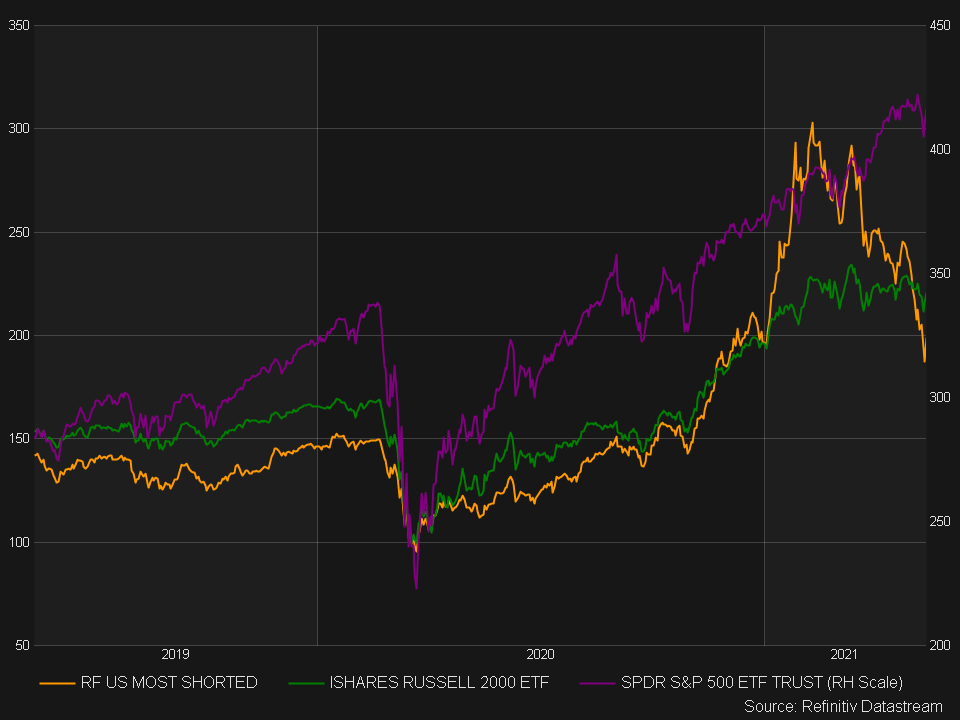
Supposing that wasn’t enough, look at the carnage that has taken place in the Refinitiv most shorted index. Remember, this index led the Russell 2000 in the fall and early winter of 2020 higher. It has collapsed, and that as the Russell goes nowhere.
Taiwan Semi
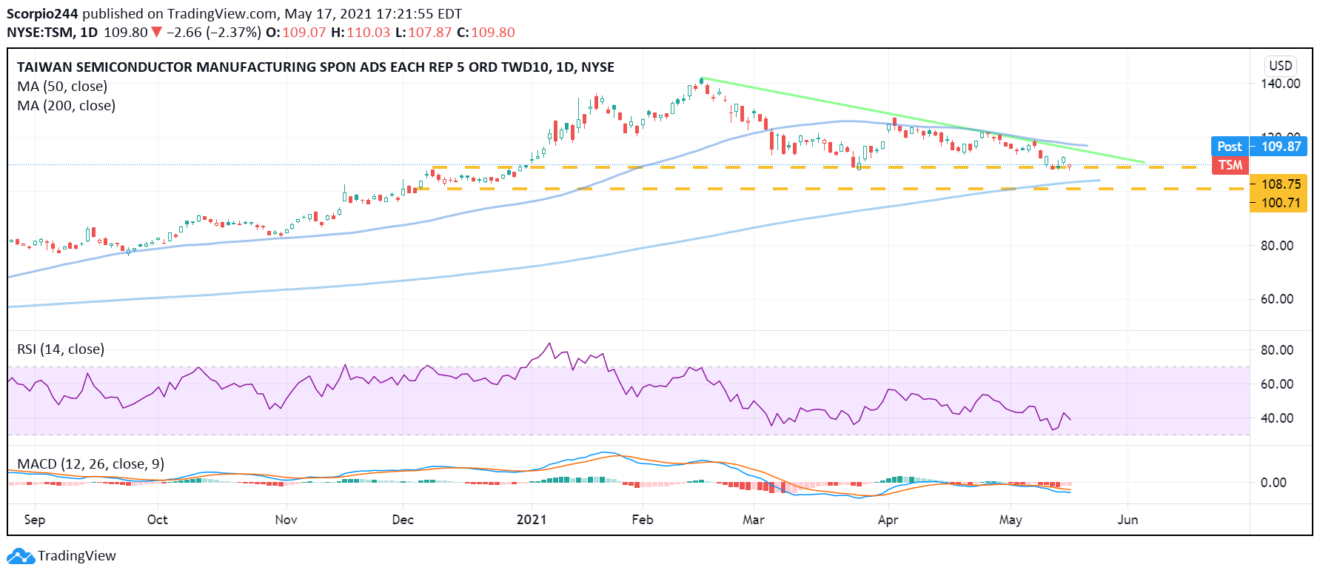
Taiwan Semiconductor Manufacturing (NYSE:TSM) may be the most important stock in the entire market at the moment. The stock market in Taiwan has been hammered in recent days, and if chips represent the new age economy where Taiwan Semi goes will tell us a lot about what happens next. Support at $109 must hold for the stock; otherwise, the next level of support is around $100. The RSI suggests that either the 200-day moving average or support at $100 is tested.
Chipotle
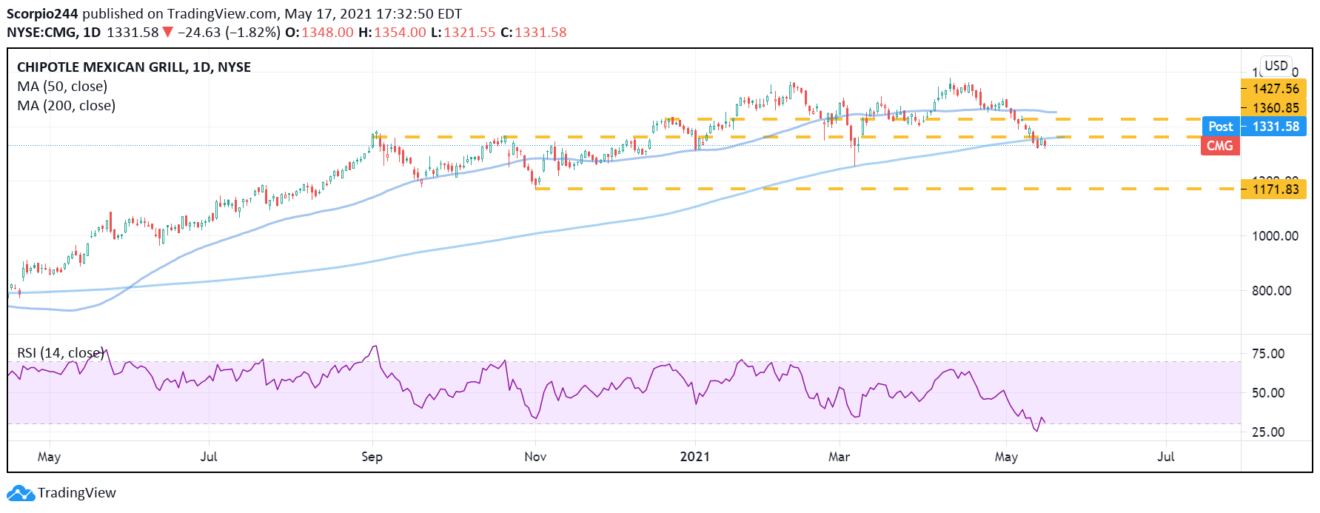
Chipotle (NYSE:CMG) is sitting on a big level of support that also needs to hold around $1,325 to $1,350. A break of support region sends the stock lower to $1,175.
JP Morgan
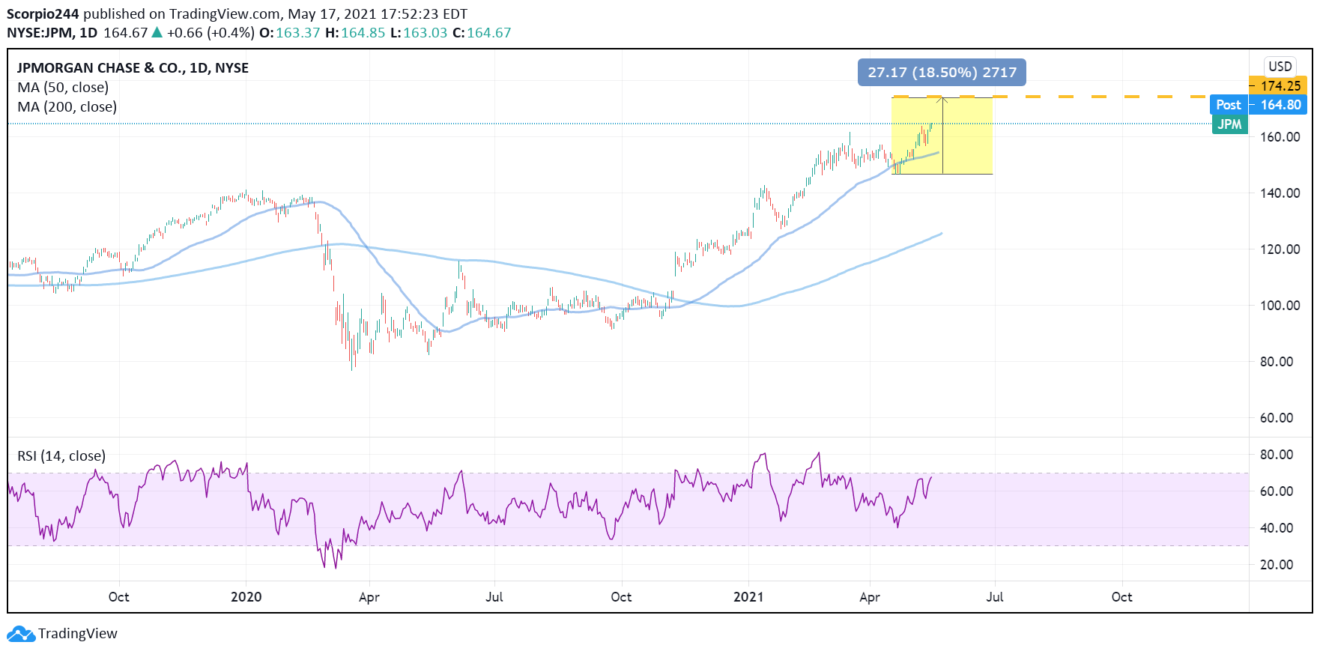
The bank stocks still look fairly good, and that is because yields are likely to rise, and the spreads are still widening. So JPMorgan (NYSE:JPM) may still have about $10 more in upside until it runs out of steam. The RSI is already diverging, which is a warning.
Wells Fargo
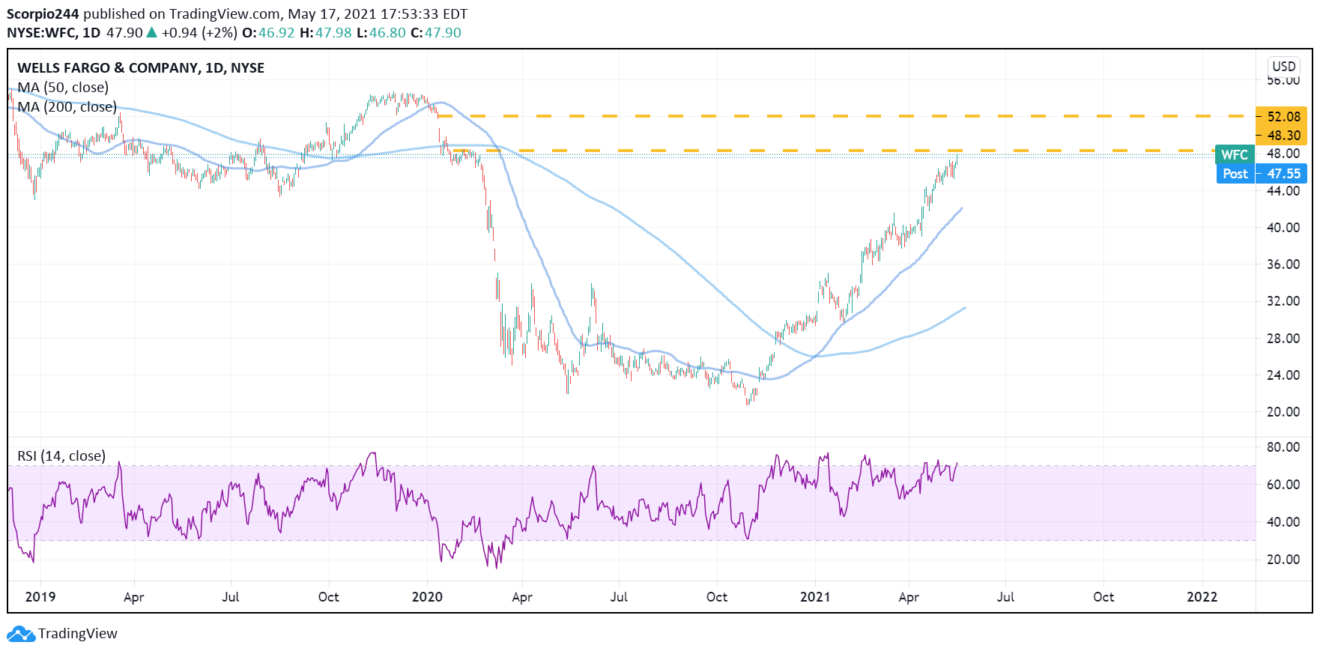
Meanwhile, Wells Fargo (NYSE:WFC) still has a gap to fill up at $52.

