Stocks finished mostly lower on Wednesday, with the S&P 500 up just 7 bps, while Invesco QQQ Trust (NASDAQ:QQQ) fell by almost 35 bps. The index had been higher nearly all day and fell sharply going into the final hour of trading.
The market looked tired at that point, and from a technical standpoint, it appeared to be breaking down, especially among the growth sector. Specifically, when you start looking at some of these stocks that lead the market higher, they appear to now be starting to lead the market lower.
The ISM data likely doesn’t help, with a number that missed estimates and prices paid that keep rising. It should make investors wonder if the growth in the economy is now slowing and headed towards Stagflation.
I’m not saying I think we are heading to stagflation, but it is a question that needs to be asked. It is possible that peak US growth is now here, or potentially behind us.
NASDAQ Qs
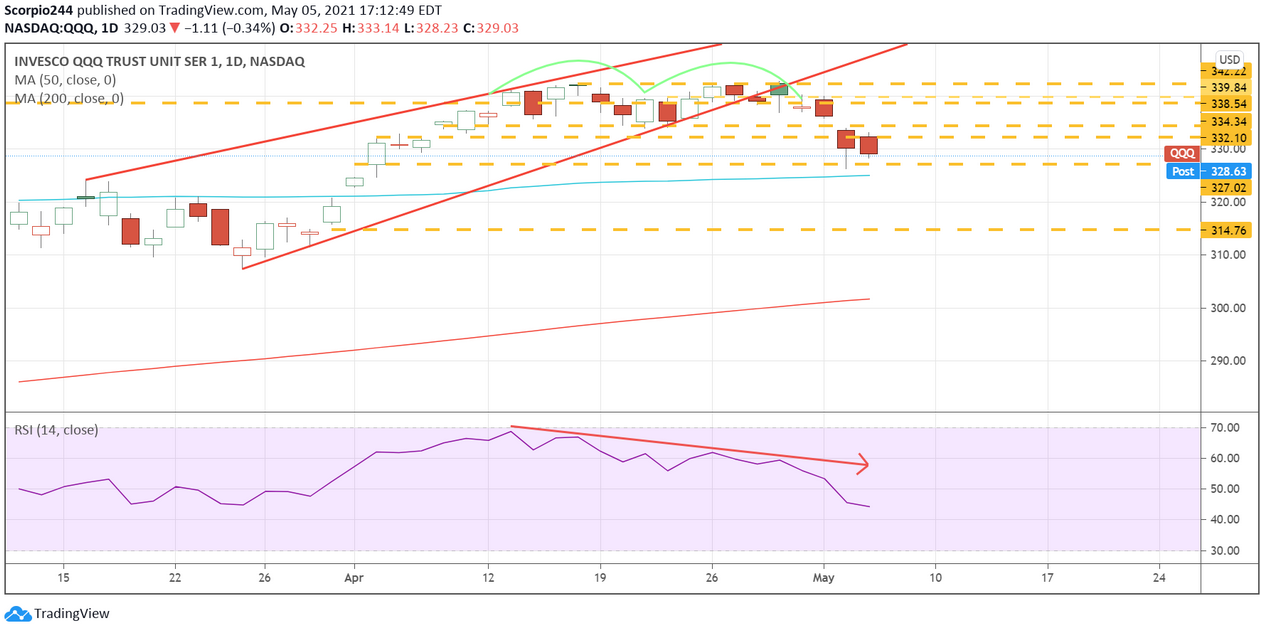
The chart below shows how the Qs opened higher but failed to get over the resistance at $332, finishing the day at the lows of the day. You can easily see the RSI is trending lower, and that would indicate to me that lower prices are likely still ahead.
Bonds
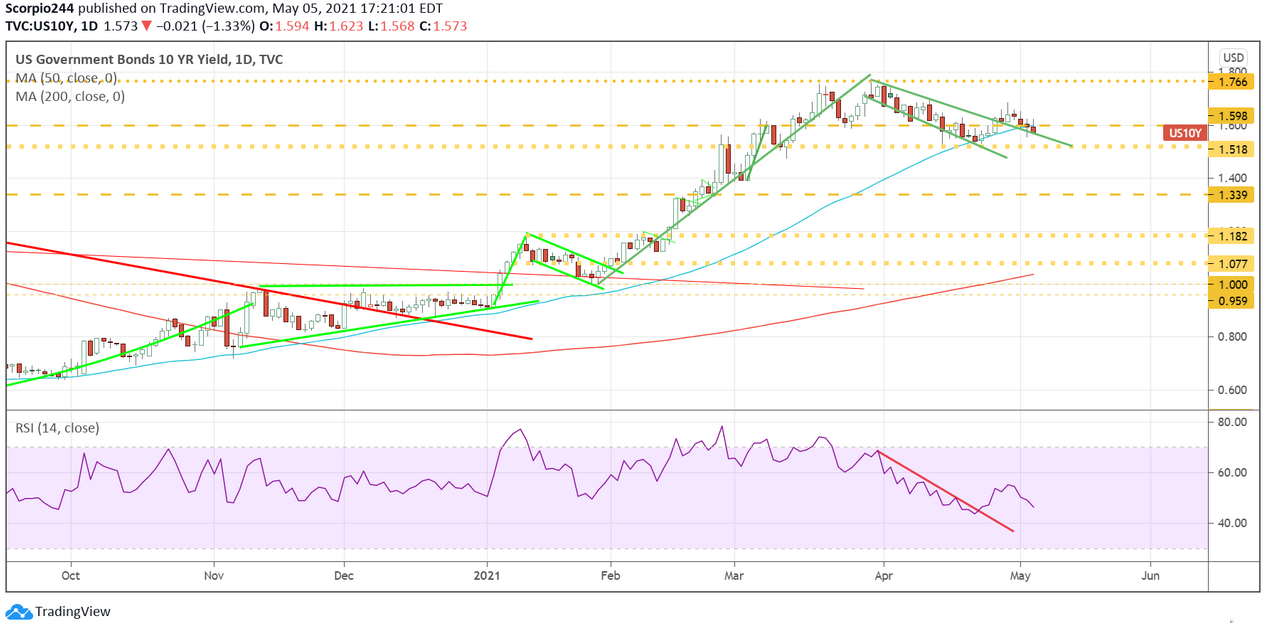
Despite the hot inflation data from the CPI report, 10-year yields fell.
Is the bond market now getting worried about slowing growth? Hard to say at his point, but certainly, a trend that needs to be monitored. I continue to think, for now, that rates are heading higher, with the potential to go beyond 2%.
Amazon
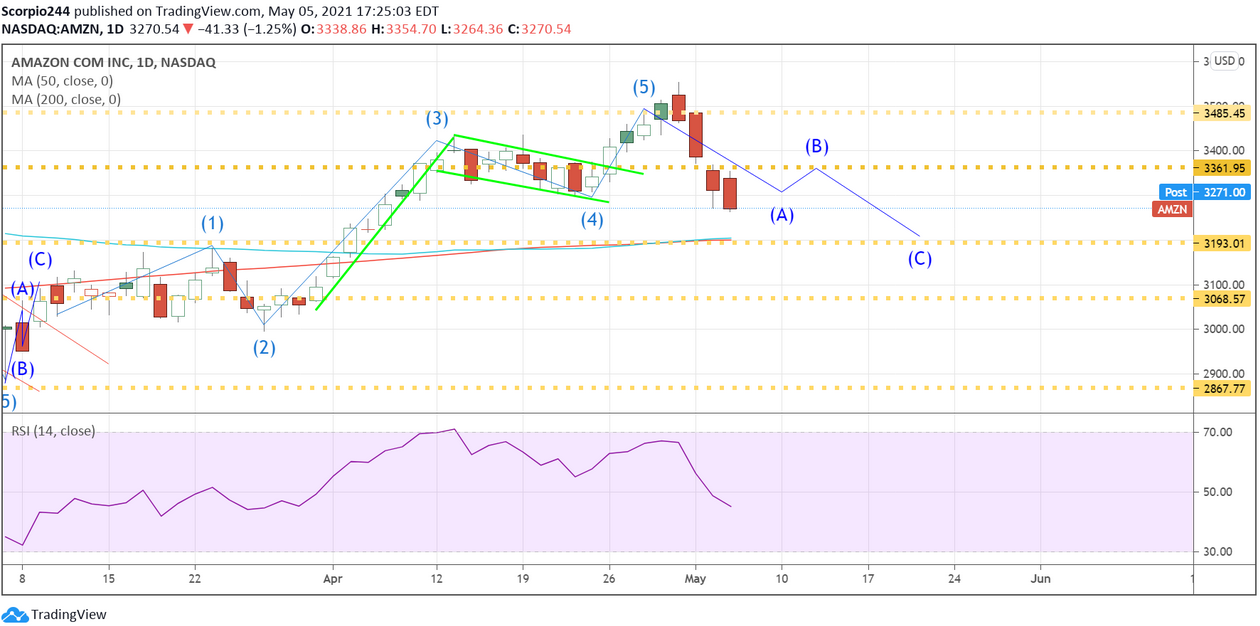
Amazon.com (NASDAQ:AMZN) fell another 1.25% yesterday and was down almost 11% from its after-hour highs last Thursday. There is still no bounce, and the RSI looks pretty bad, and the next level of support is around $3,200.
Uber
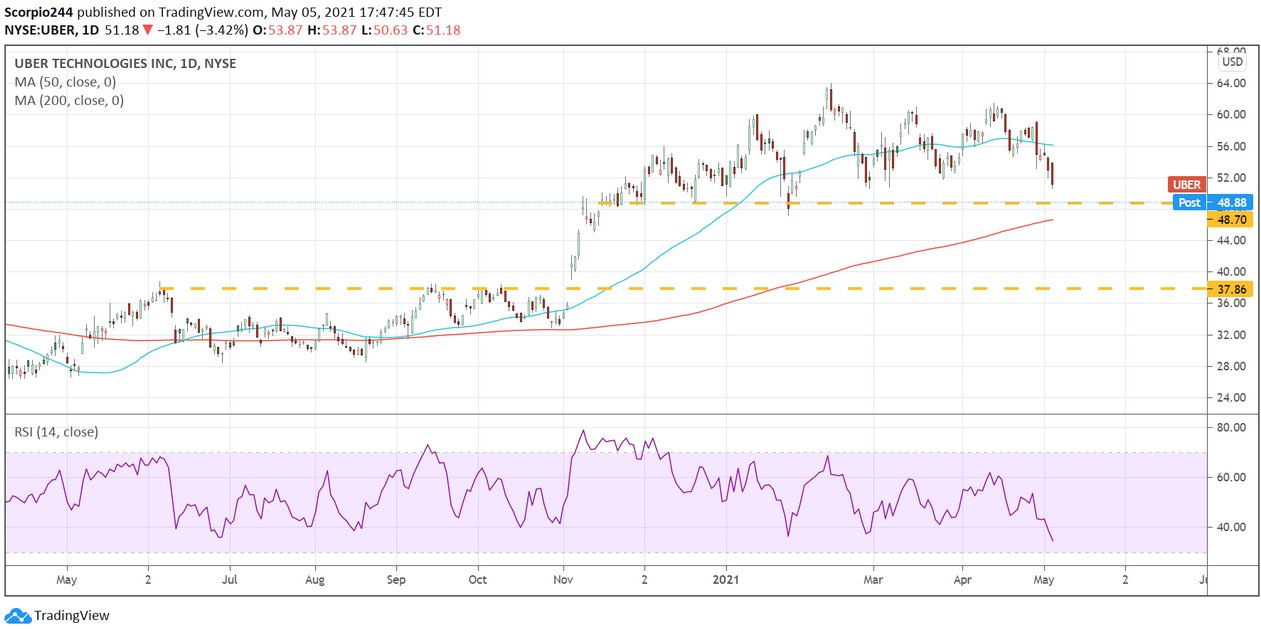
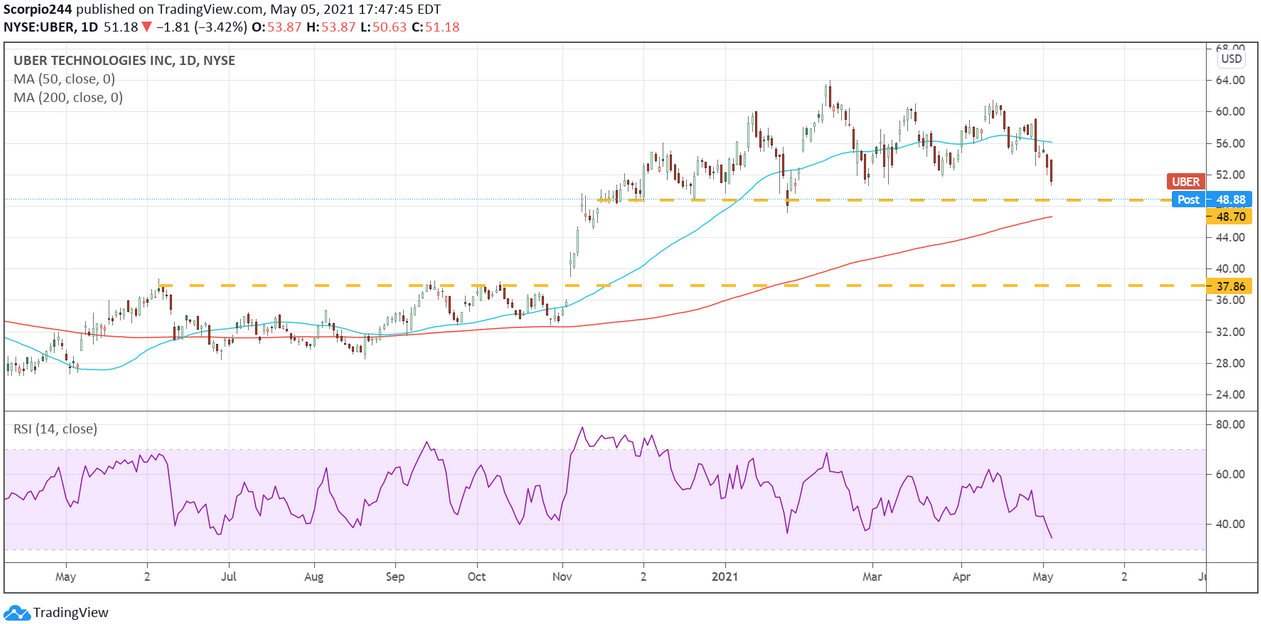
Uber Technologies (NYSE:UBER) was getting hit hard following results. I’m not even getting into those results. These guys either lose a huge sum of money every quarter or miss revenue estimates. They can’t seem to hit on all gears. The stock is currently right on support at $48.70 Wednesday evening; a break of that level sends the shares lower towards $37.85.
Zoom
Zoom Video Communications (NASDAQ:ZM) fell below $300 for the first time in forever, and that is going to put this one on a path to $275.
Twilio
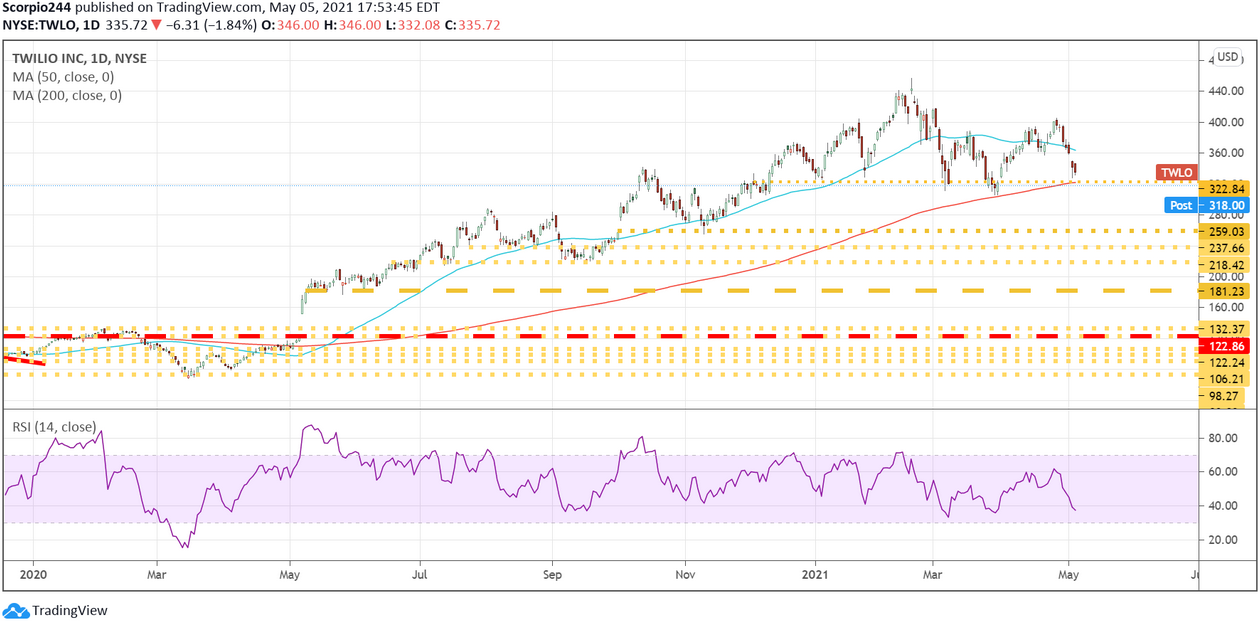
Like Uber, Twilio (NYSE:TWLO) is on the cusp of a huge breakdown. Trading in the after-hours around $320. The next level to watch for comes at $260.
Acadia
ACADIA Pharmaceuticals (NASDAQ:ACAD)—I don’t know what to say. No type A meeting even scheduled, let alone had. They haven’t filed or had the meeting yet due to putting together the briefing documents. Too slow, in my opinion, they should be working day and night to get this process moving. Still have to sit and wait, I guess.
