Get 40% Off
🚨 Volatile Markets? Find Hidden Gems for Serious OutperformanceFind Stocks Now

Stocks Drop As Amazon Reaches Death Cross

Published 05/11/2021, 12:39 AM
Updated 09/20/2023, 06:34 AM

Stocks had a very lopsided day yesterday, with the S&P 500 dropping by around 1%, while the NASDAQ fell by nearly 2.7%.

The growth stocks got hit the hardest, while the reflation names had some big intra-reversal. Overall, Monday was not a pretty day, with many big reversals throughout, not just in stocks, with copper marking a big reversal lower, at time of writing.

For now, the 5-wave count I pointed out on Sunday stands and based on that, I would think the index could finally make that push back to 3,960 we spoke about a month ago.
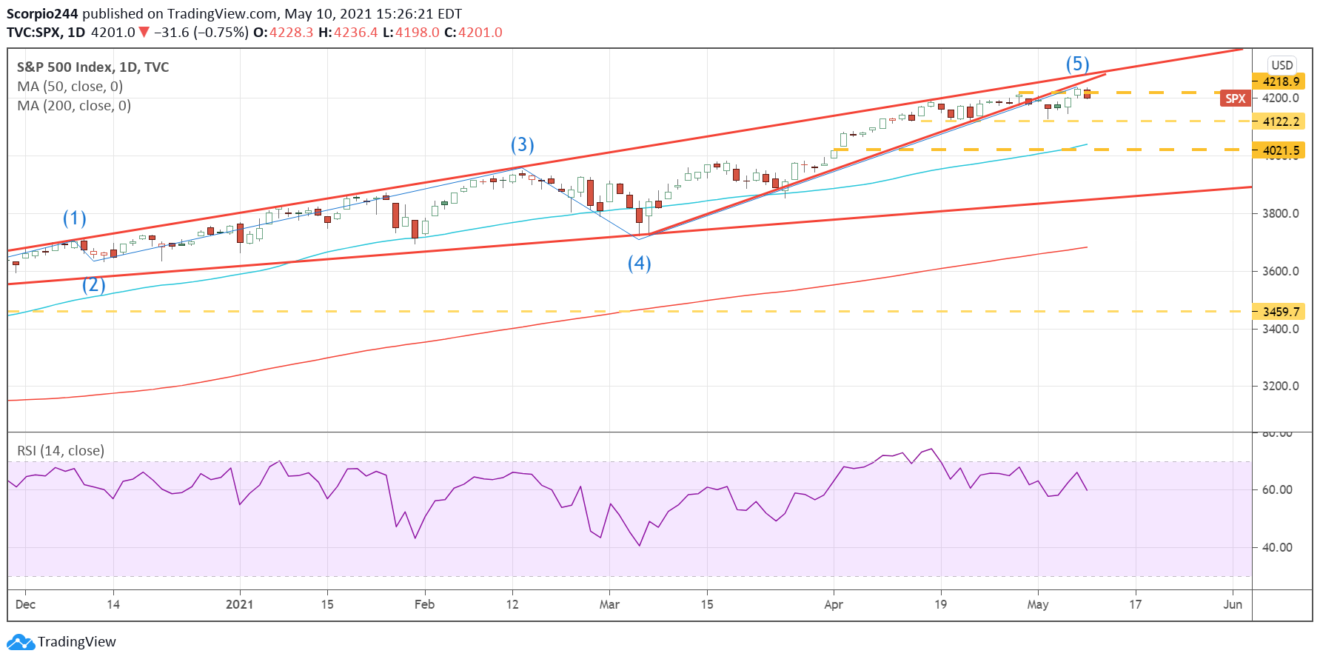
SPX Daily Chart

Copper

The copper reversal was notable, especially after a big run-up. It is the type of price action you see at the end of a run higher. Copper has certainly had a big run higher, and a drop back to $4.50 certainly doesn’t seem unlikely.
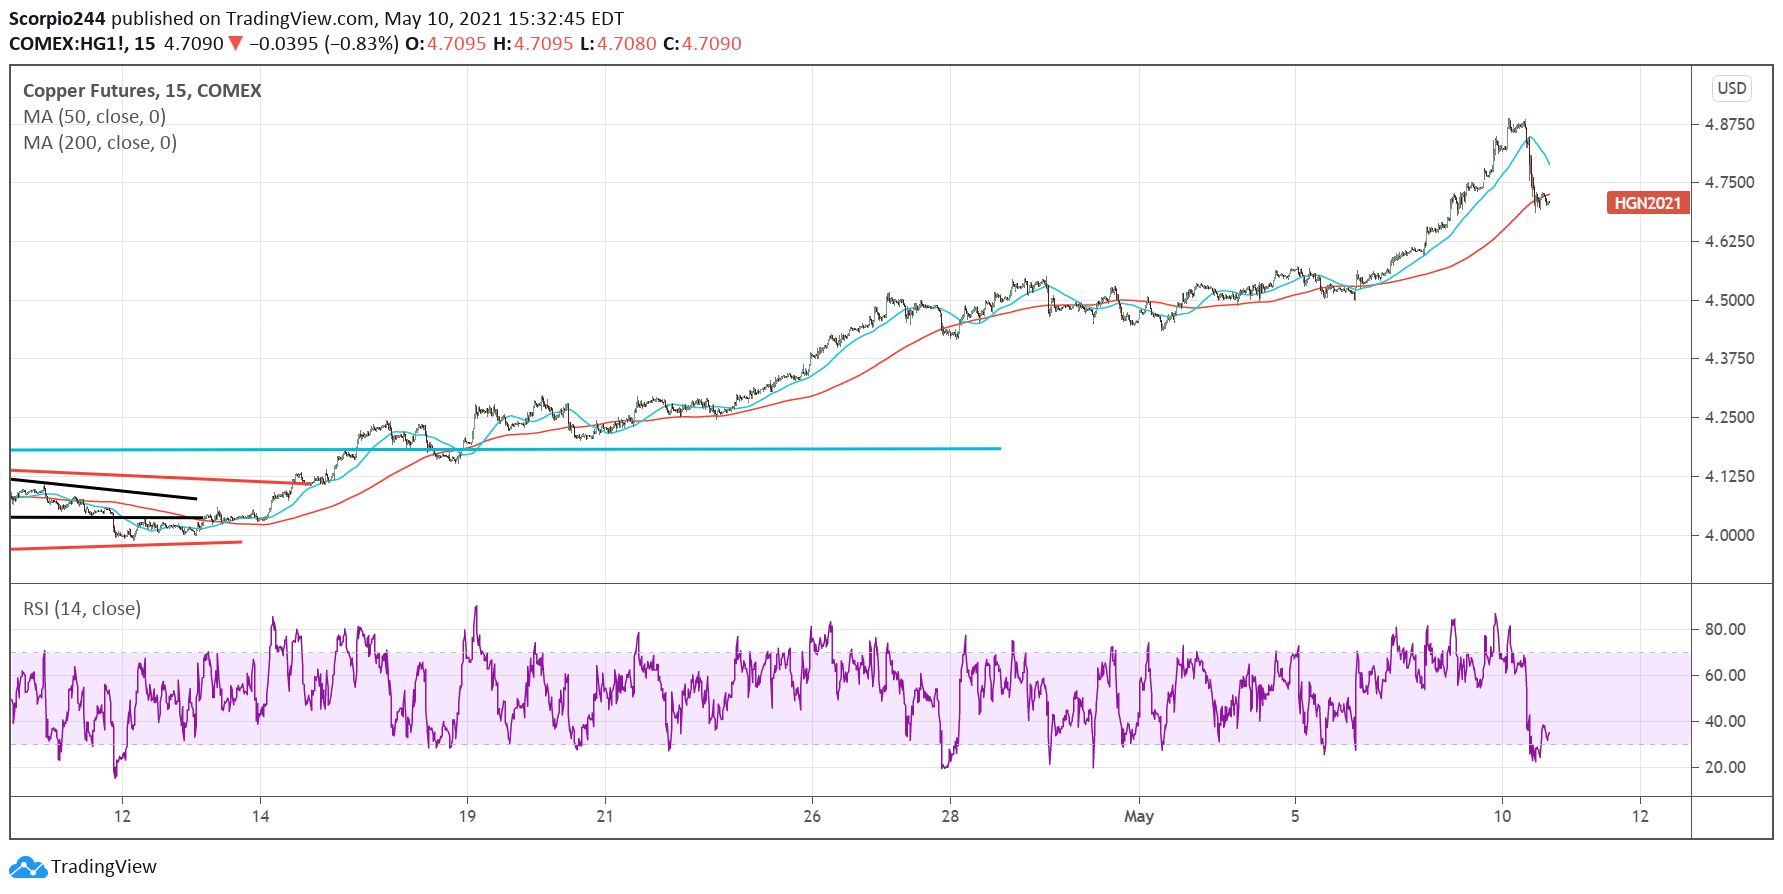
Copper Futures Chart

Freeport

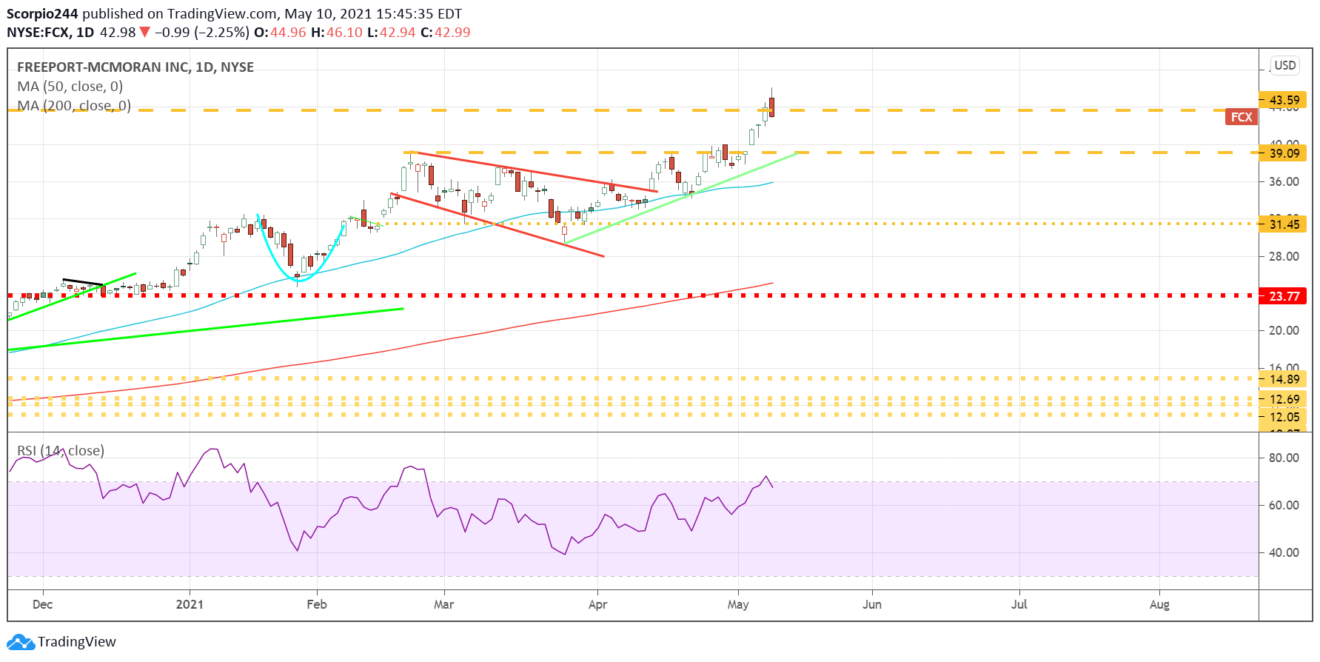
Freeport-McMoran Copper & Gold (NYSE:FCX) was one of the stocks that had a big reversal yesterday, after gapping higher. It left the stock trading below support at $43.60. Given the big reversal, it would not be surprising in the least to see the stock reverse lower towards $39.

Freeport Inc Daily Chart

Amazon

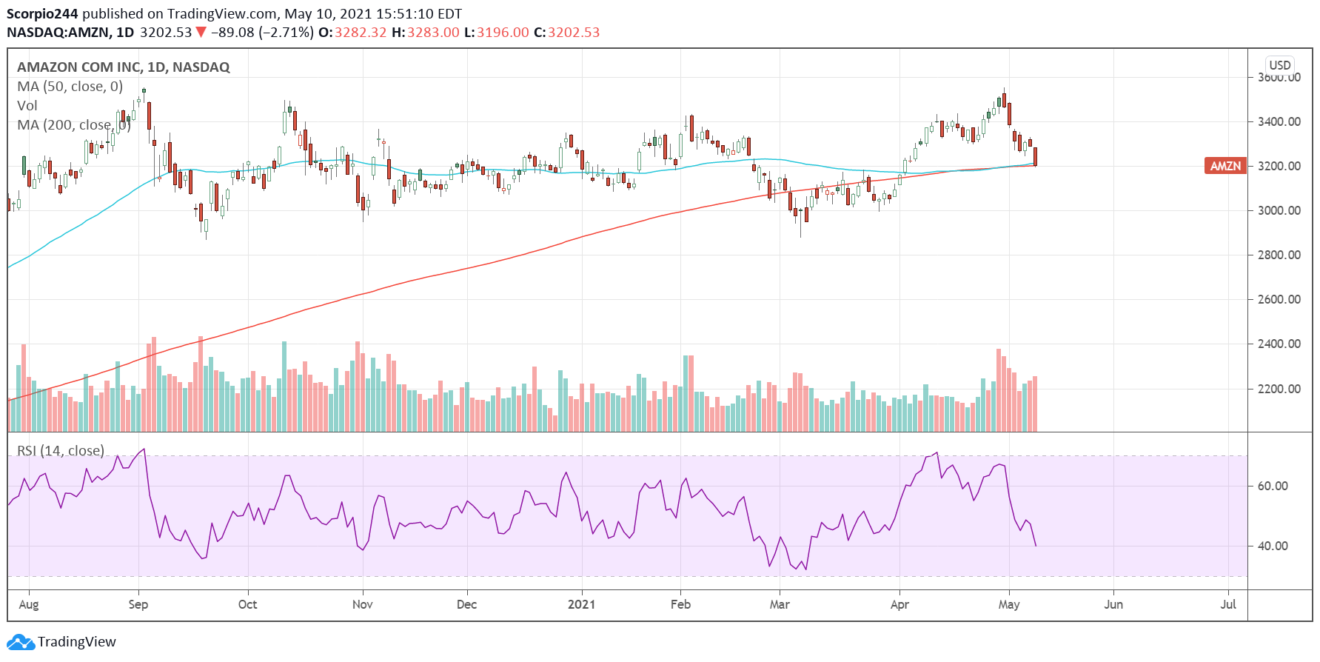
Amazon.com (NASDAQ:AMZN) came to a crossroads as it approached its 200-day moving average. This could be a big turning point for the stock, as a break of the 200-day moving average would certainly be a long-term momentum breaker.

It has already tested this level once and survived; the question is if it can do it again? The only difference is that this time, the 50-day and the 200-day meet to form a death cross.

3rd party Ad. Not an offer or recommendation by Investing.com. See disclosure here or remove ads .

The selling has come on strong volume.

Amazon Inc Daily Chart

Micron

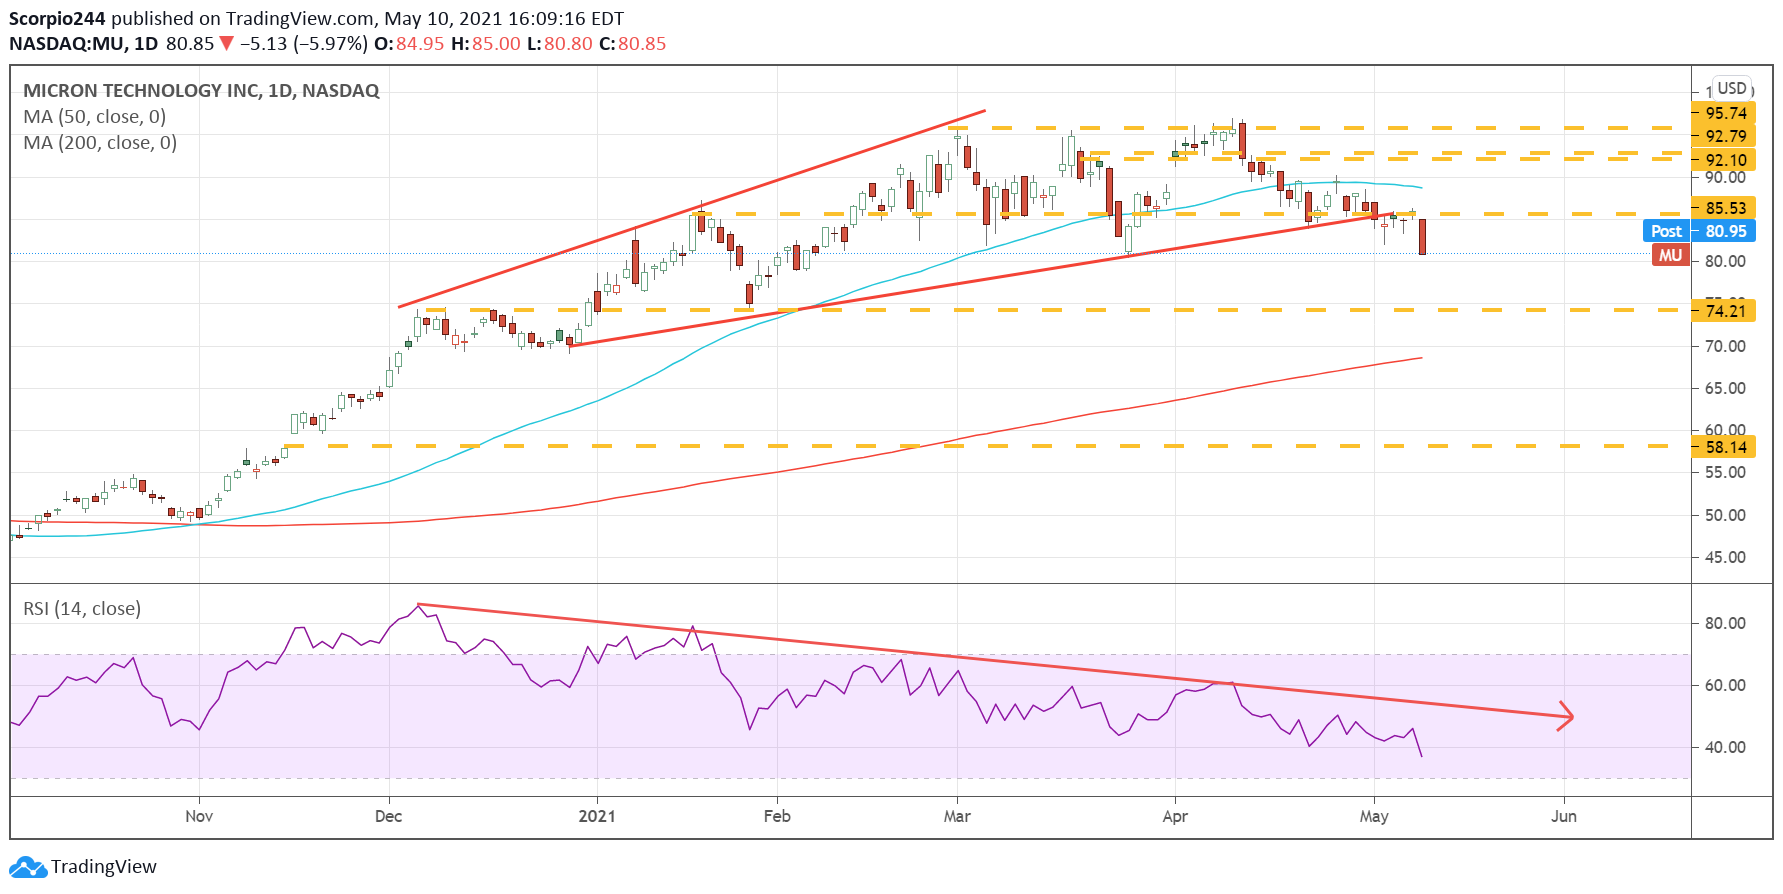
Micron Technology (NASDAQ:MU) was hit hard Monday too, falling by almost 6%. The stock is probably now on its way to $74. I have been waiting for $74 for a while; maybe this time, it finally happens. The RSI says there is further to fall.
Micron Inc Daily Chart

JD.com

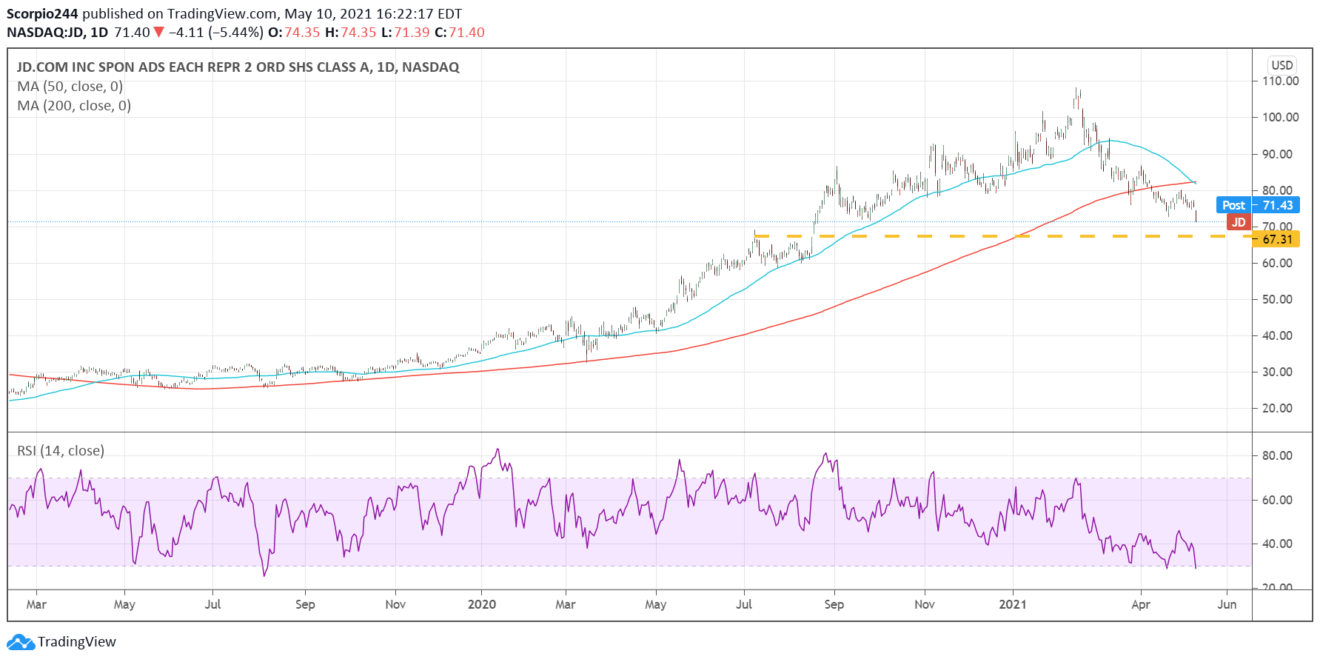
JD.com (NASDAQ:JD) has to hold support at $67.30 to avoid a bigger meltdown. The death cross was in play with the 50-day crossing over the 200-day.

JD.com Daily Chart

Original Post

Latest comments

Risk Disclosure: Trading in financial instruments and/or cryptocurrencies involves high risks including the risk of losing some, or all, of your investment amount, and may not be suitable for all investors. Prices of cryptocurrencies are extremely volatile and may be affected by external factors such as financial, regulatory or political events. Trading on margin increases the financial risks.
Before deciding to trade in financial instrument or cryptocurrencies you should be fully informed of the risks and costs associated with trading the financial markets, carefully consider your investment objectives, level of experience, and risk appetite, and seek professional advice where needed.
Fusion Media would like to remind you that the data contained in this website is not necessarily real-time nor accurate. The data and prices on the website are not necessarily provided by any market or exchange, but may be provided by market makers, and so prices may not be accurate and may differ from the actual price at any given market, meaning prices are indicative and not appropriate for trading purposes. Fusion Media and any provider of the data contained in this website will not accept liability for any loss or damage as a result of your trading, or your reliance on the information contained within this website.
It is prohibited to use, store, reproduce, display, modify, transmit or distribute the data contained in this website without the explicit prior written permission of Fusion Media and/or the data provider. All intellectual property rights are reserved by the providers and/or the exchange providing the data contained in this website.
Fusion Media may be compensated by the advertisers that appear on the website, based on your interaction with the advertisements or advertisers.
© 2007-2024 - Fusion Media Limited. All Rights Reserved.