- Mixed earnings and protectionism weigh on equities
- Trump’s Fed criticism topples dollar from yearly high
- Rising yields signal risk-on, but pattern raises probability for reversal
- Escalating trade war slows demand for oil
US stocks and the dollar reversed much of their gains last week as President Trump criticized the Federal Reserve and company earnings weren’t robust enough to brush aside political risks.
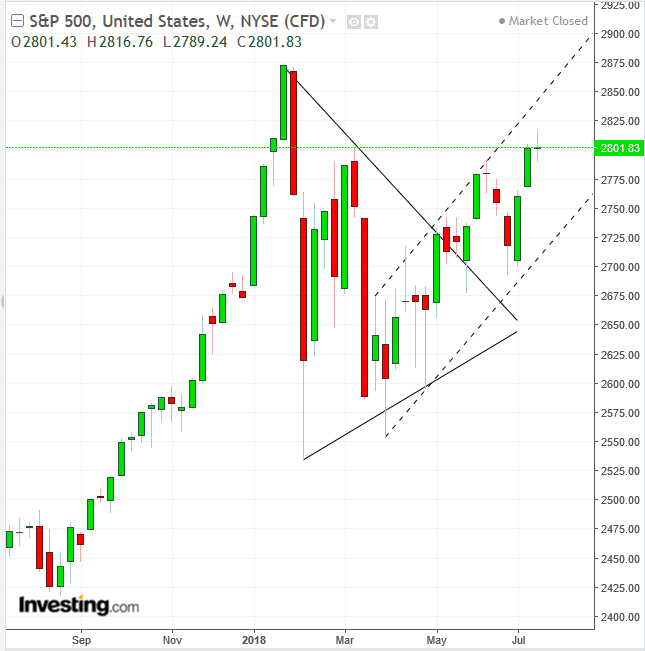
The S&P 500 by mid-week had risen to 2% from its record high and the dollar reached the highest level in a year after Federal Reserve Chairman Jerome Powell made positive comments about the economy. Then, Trump spoke, saying that Fed tightening 'hurts all that we have done.' The president also threatened fresh tariffs on China. In the meantime, earnings were mixed with Netflix (NASDAQ:NFLX) missing its own subscriber target and GE slumping.
The S&P ended up rising 0.09% for the week with the Dow Jones Industrial Average eking out a third of that gain. Nasdaq rose 0.07% for the week.
How will all this turn out? While the recent earnings disappointment, compounded by the latest round of protectionist rhetoric may indeed spur a correction, the trend remains intact. We’re betting on stocks challenging record highs. Investors have proven their bullishness for as long as the economy continues to chug along, and we’re jumping along for the ride.
S&P 500 Daily Chart

As we have repeatedly argued, Trump may be egged on to resume the trade war, as it appears that he’s winning. While China’s economy and markets decline further, those of the US are rising.
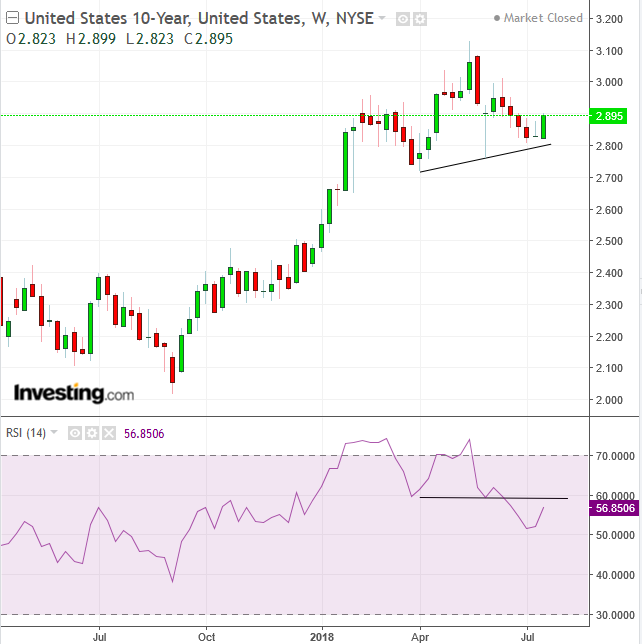
10-Year Yields

Meanwhile, the yield curve flattening continues. In the same time, 10-year yields jumped for the week, considered a bullish sign, as demand for Treasuries receded. Technically, the jump occurred above the potential neckline of an H&S reversal, which may be signaled with a negative divergence by momentum, which already broke down. Should the pattern complete, with a downside breakdown of the neckline, it would be a bearish sign, as it would signal an outlook for rising demand for government securities
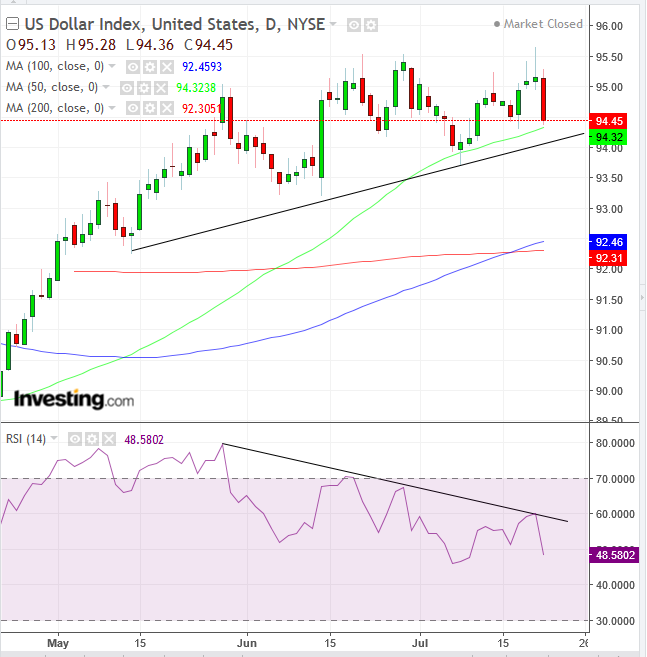
US Dollar Index Daily Chart

Trump knocked the dollar off its yearly high when he took on the Fed. Traders heard the president's attack and figured it's time to sell. However, does the president have any influence over the Fed? No. The Fed is not funded by Congress but from the interest on government bonds, to protect it from governmental control. If anything, the interference may lead to a backlash, as the Fed may feel the need to demonstrate its independence by erring on the side of further increases.
On the one hand, the dollar has been crawling higher, with the support of the major moving averages, as each MA crossed above a longer MA, demonstrating that more recent prices are strengthening relative to more extended sets of rates. On the other hand, it has been doing so on weakening momentum. The RSI has provided a negative divergence, suggesting that prices may follow lower. The price would offer another bearish signal, were it to cross below the uptrend line since mid-May. On the other hand, a close above 95.50, would demonstrate that demand absorbed all available supply at these levels, and is prepared to bid higher prices, in search of more willing sellers
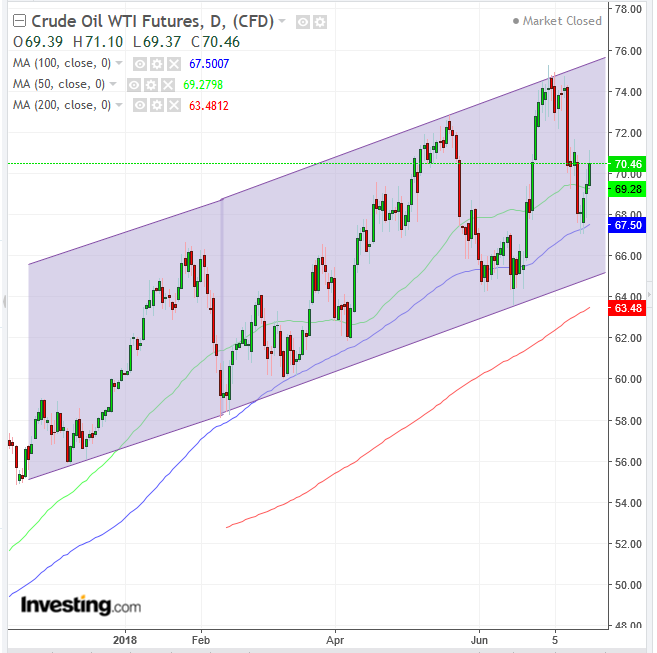
WTI Daily Chart

Fundamentally, oil posted its third consecutive weekly loss amid concern the escalating trade rows will undercut energy demand, undermining reassurances from Saudi Arabia that it won’t flood global crude markets.
Technically, the price crossed back above the 50 DMA (green), after finding support by the 100 DMA (blue), while the 200 DMA (red) traces a rising channel since November 2017. In other words, despite all the known fundamental uncertainty, the fall was considered a correction after having posted a new peak of $75.27, July 3, by the demand that picked it up from the Tuesday, $67.03 low through the Friday, $70.46 closing price. Finally, a close above the round-psychological number demonstrates that traders were comfortable to remain exposed over a weekend at a price level that tends to attract volatility.
The Week Ahead – All Times Posted in EDT
Monday
8:30 – US Chicago Fed National Activity Index (June): forecast to rise to 0.4 from -0.15.
10:00 – Eurozone Consumer Confidence (July, flash): forecast to fall to -0.7 from -0.5.
10:00– US Existing Home Sales (June): expected to rise 0.5 MoM from -0.4%.
20:30 – Japan Manufacturing PMI (July, flash): index forecast to grow to 53.2 from 53.
Tuesday
3:00-4:00 – French, German, Eurozone PMIs (July, flash): Eurozone services PMI to fall to 55 from 55.2.
10:45 – US Manufacturing PMI (July, flash): manufacturing expected to decrease to 55.1 from 55.4.
Wednesday
4:00 – German IFO index (July): business climate index to fall to 101.6 from 101.8.
10:00 – US New Home Sales (June): forecast to fall 2.8% MoM from a 6.7% rise.
10:30 – US EIA Crude Inventories (w/e 20 July): stockpiles forecast to decline by 3.4 million barrels from a 5.8 million increase a week earlier.
Thursday
2:00– German GfK Consumer Confidence (August): expected to remain at 10.7.
7:45 – ECB Rate Decision: no change in policy expected but watch for comments about potential changes in the future.
8:30 – US Durable Goods Orders (June): forecast to rise 2.7% MoM from -0.4%.
Friday
8:30 – US GDP (Q2, first reading): Growth forecast to be 4.1% QoQ.
10:00 – US Michigan Confidence Index (July, final): forecast to increase to 97.3 from 97.1.
