Wednesday June 27: Five things the markets are talking about
Lingering concerns about trade is keeping global equities muted, although gains in oil prices have been supporting stocks of oil-and-gas companies.
Crude prices have built on yesterday’s gains after the U.S. stepped up its pressure on Iran. West Texas Intermediate crude is trading atop of a one-month high, as Washington demanded that Iran’s customers halt imports.
In currencies, China’s yuan appears to have found a temporary floor after its rapid decline this week, while Japan’s yen is again attempting to outperform it G10 counterparts, while sovereign bonds are found wanting.
On tap: RBNZ monetary policy decisions is this afternoon (05:00 pm EDT), while U.S personal spending is expected to have increased for a third consecutive month on Friday. On Saturday, China manufacturing and non-manufacturing PMI are due.
1. Stocks see red
Asian stocks closed lower across the board after Chinese equities fell into a ‘bear’ market yesterday.
In Japan, the Nikkei share average dropped overnight after higher oil prices hurt rubber products makers, airlines and shippers, while companies’ going ex-dividend added to the market’s broader weakness. The benchmark Nikkei closed down -0.3%, while the broader TOPIX eked out a small gain of +0.02%.
Down-under, Aussie stocks faded late and left the S&P/ASX 200 with a fourth-straight decline of -0.03%. S Korea, both the KOSPI and won collapsed overnight as the escalating U.S-China trade conflict dented investor sentiment. The index was down -0.38%.
In Hong Kong and China, stocks also fell to trade atop of their seven-month lows as the Yuan’s slide adds to China growth fears. In Hong Kong, the Hang Seng index fell -1.8%, while the China Enterprises Index lost -2.2%.
In China, the CSI300 index fell -1.2%, while the Shanghai Composite Index lost -0.5%.
Note: China’s yuan weakened beyond the psychologically $6.600 level and bets are growing for further downside amid the escalating Sino-U.S trade row.
In Europe, regional bourses remain under pressure as concerns over trade remain the theme of the risk off sentiment in markets.
U.S stocks are set to open in the ‘red’ (-0.7%).
Indices: Stoxx 50 -0.9% at 3,344, FTSE 100 -0.3% at 7,520, DAX -0.6% at 12,158, CAC 40 -0.6% at 5,249; IBEX 35 -1.2% at 9,521, FTSE MIB -1.0% at 21,195, SMI -1.2% at 8,376, S&P 500 Futures -0.7%

2. Oil rises on supply losses and on U.S. push to isolate Iran
Oil prices are better bid on a supply disruption in Canada, falling U.S crude stocks, uncertainty over Libyan exports and after the Trump administration telling importers to stop buying Iranian crude from November.
Brent crude is up +30c a barrel at +$76.61, while U.S light crude is +25c higher at +$70.78.
A supply outage at Syncrude in Canada has locked in +350K bpd of crude, with repairs expected to last at least through the end of next month.
Note: The fall in Canadian exports has helped drain supplies of heavy crude across North America and contributed to a major draw in US crude oil inventories according to Analysts.
U.S API data yesterday reported a much-higher-than-expected -9.2M barrel reduction in U.S crude inventories in the week to June 22 to +421.4M barrels.
Also keeping markets on edge was the risk of a disruption to oil supplies from the Africa and the Middle East.
Ahead of the U.S open, gold prices have hit a seven-month low as the U.S dollar steadied and investors turned to other safe-haven assets amid expectations of more interest rate hikes by the Fed. Spot gold fell for a third straight session and is down -0.3% at +$1,255.51 an ounce. U.S gold futures for August delivery are -0.2% lower at +$1,257.30 per ounce.

3. Sovereign yields fall on risk aversion trading
Global sovereign yields remain under pressure, mostly on trade tensions.
The yield on Germany’s 10-year Bund remains under pressure after E.U leaders failed to reach a deal on a new approach to immigration. The 10-year Bund yield fell -2 bps to +0.31%.
For further directional cues, dealers will now look to the E.U summit on immigration this Thursday and Friday as well as Friday’s release of eurozone inflation numbers, which could see core inflation, drop to +1%.
Elsewhere, the yield on 10-year Treasuries fell -2 bps to +2.86%, the lowest in more than three-weeks, while in the 10-yearGilt yield fell -3 bps to +1.273%.
There is only one central bank meeting this week and its today’s RBNZ monetary policy announcement (05:00 am EDT) where they are expected to deliver a ‘dovish’ tone and signal again that the next move could be “up or down.”

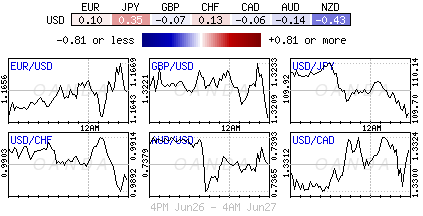
4. Sterling falls as uncertainty grows over BoE outlook
Sterling remains under pressure (£1.3210), remaining weak after yesterday’s testimony from incoming BoE policymaker Jonathan Haskel was taken as a suggestion that he is not inclined to raise interest rates. The intraday low overnight was £1.3196. EUR/GBP is up +0.1% to €0.8811
Note: He is set to replace Ian McCafferty, who has consistently voted to increase rates in recent months. Many expect the BoE to hike rates in August, though many investors are nervous given economic and Brexit-related uncertainties.
The People’s Bank of China (PBoC) set the dollar’s reference rate at ¥6.5569 yuan, which meant the yuan was -0.6% lower than the previous session. The “fix” put the yuan at its weakest level since Dec. 25, 2017.
EUR/USD (€1.1642) remains confined to a tight range in quiet trading. Focus will now turn to key Euro inflation data – German CPI on Thursday and E.U Flash CPI on Friday.
Note: Chancellor Merkel’s German coalition failed to find an agreement of the migrant issue ahead of the upcoming E.U leader summit beginning tomorrow.

5. Eurozone bank lending picks up
The recovery in eurozone bank lending continued in May.
Data from the European Central Bank (ECB) saw lending to non-financial corporations grow at an annual rate of +3.6% in May, which marks the highest rate in nine-years. In April it was +3.3%.
Digging deeper, lending to eurozone households was also robust. It grew at an annual rate of +2.9% in May, the same rate as in April, according to the ECB.
Nevertheless, despite the pick up in lending across sectors, lending rates remain well below pre-crisis levels. In 2007, bank lending to businesses was running at rates well above +12%.
The ECB’s key indicator of the money supply, meanwhile, picked up unexpectedly, with the annual growth rate of M3 rising to +4.0% from +3.8% in April.