Get 40% Off
🚨 Volatile Markets? Find Hidden Gems for Serious OutperformanceFind Stocks Now

Stocks Are Overbought And Likely To Be Dragged Lower Short-Term

Published 04/08/2021, 12:51 AM
Updated 09/20/2023, 06:34 AM

The Fed minutes revealed very little if anything new today. The Fed remains committed to data-driven monetary policy, which is likely to stay low for a long time. However, I don’t think the yield curve reverting to 2020 levels anytime soon.

We got the big move we talked about late last week. At the time, I thought the move favored a drop, not a rise, but we got the rise. However, we have stalled out around 4,080 on the S&P 500, and based on the largest open interest level in the options, 4,000 is likely where the most gamma is concentrated. That is going to keep the index from moving much higher, especially with options expiration next week. 4,100 has a big level of interest too, but I’m not sure if it is enough.

Additionally, the index is overbought based on the upper Bollinger band and will likely results in a drop to fill some of the opening gaps, with the potential of it falling to 3,960.
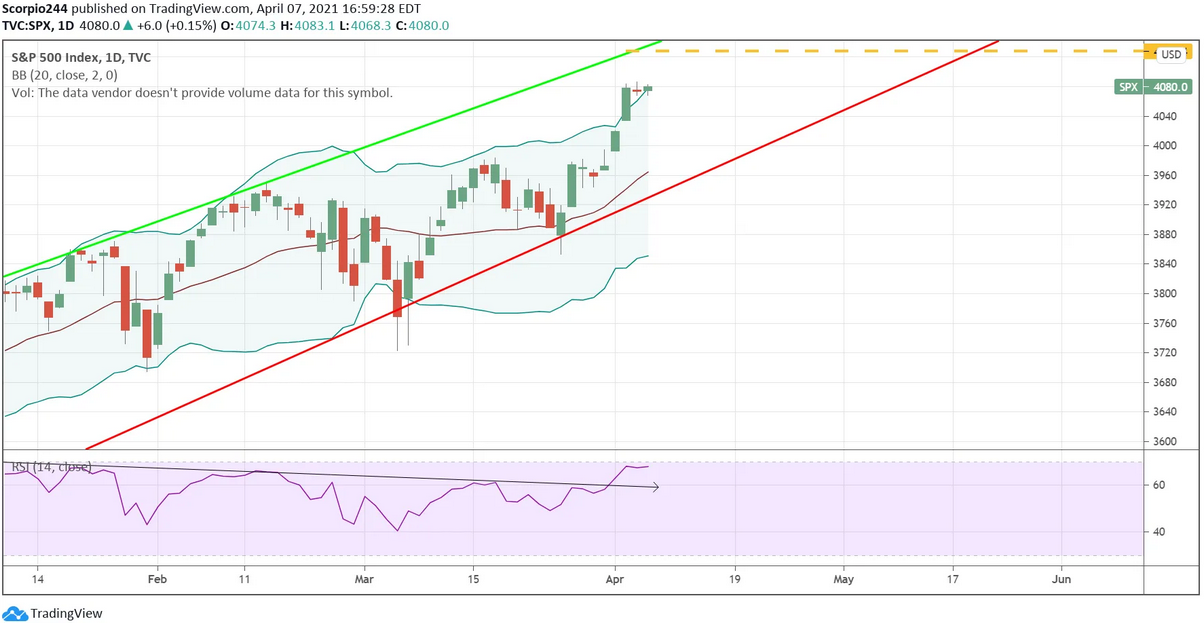
SP 500 Index Daily Chart

Meanwhile, total call volume continues to drop across the market, which has really helped sink the VIX index to 17.2.
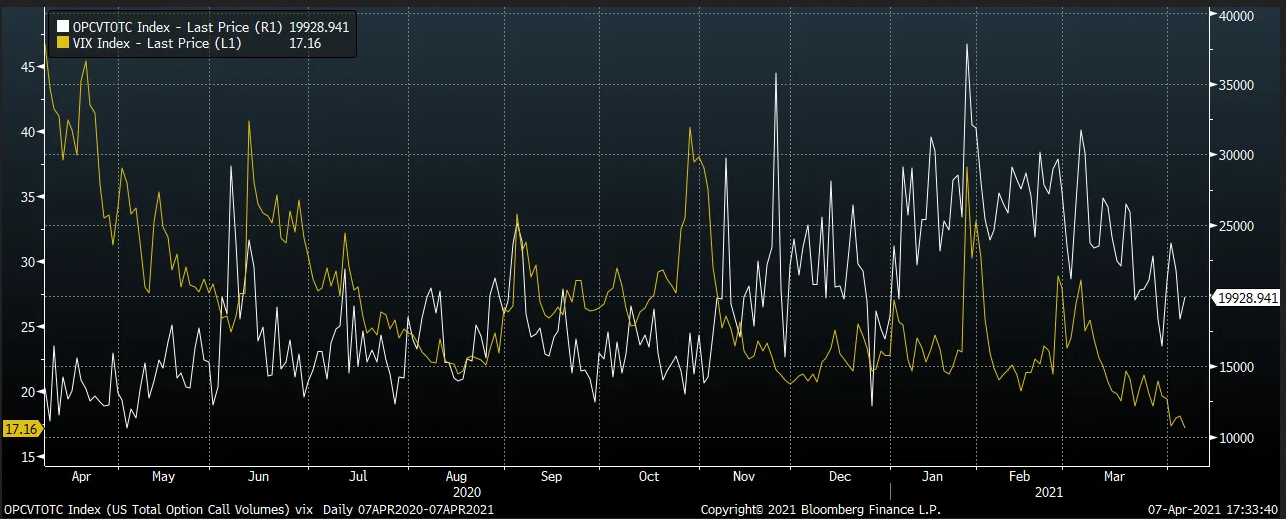
OPCVTOTC And VIX Index Chart

Biotech

The XBI ETF was hit hard today, falling by 2.4%, and it has given back much of last week’s advance. This has occurred across the Russell 2000, which fell by 1.6% and may be a sign of what is to come for the S&P 500 and NASDAQ 100.
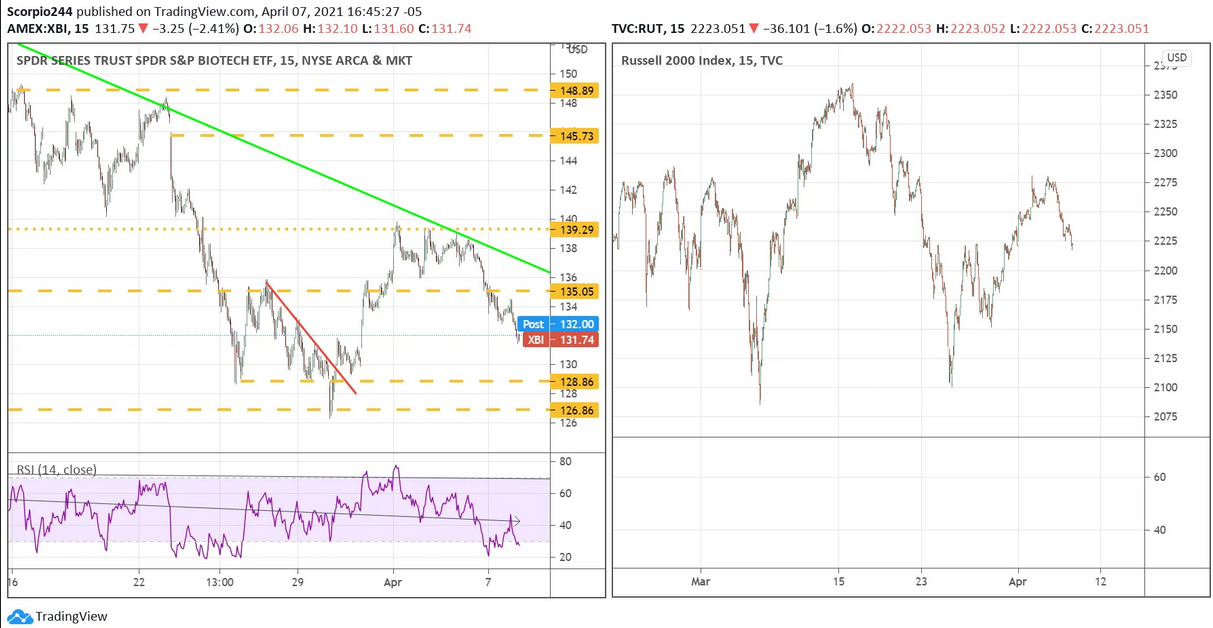
XBI Chart

Tesla

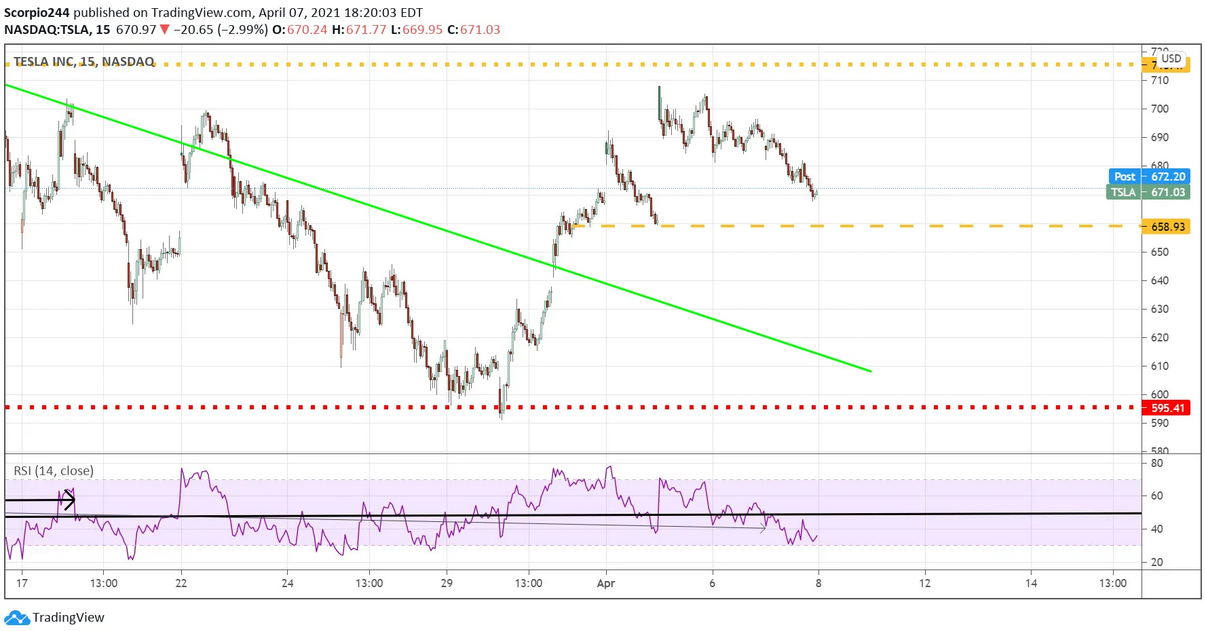
Tesla (NASDAQ:TSLA) has fallen after the big gap higher on Monday. For now, this looks like a typical gap fill, but clearly, a drop below $659 would indicate something worse, with a retest of $600 possible.
3rd party Ad. Not an offer or recommendation by Investing.com. See disclosure here or remove ads .

Tesla Inc Chart

Zoom

Zoom Video (NASDAQ:ZM) has not contributed to this recent rally and has been trying to hang on to support at $320. If it can’t get over $325 soon, a drop to $275 may very well become a reality.
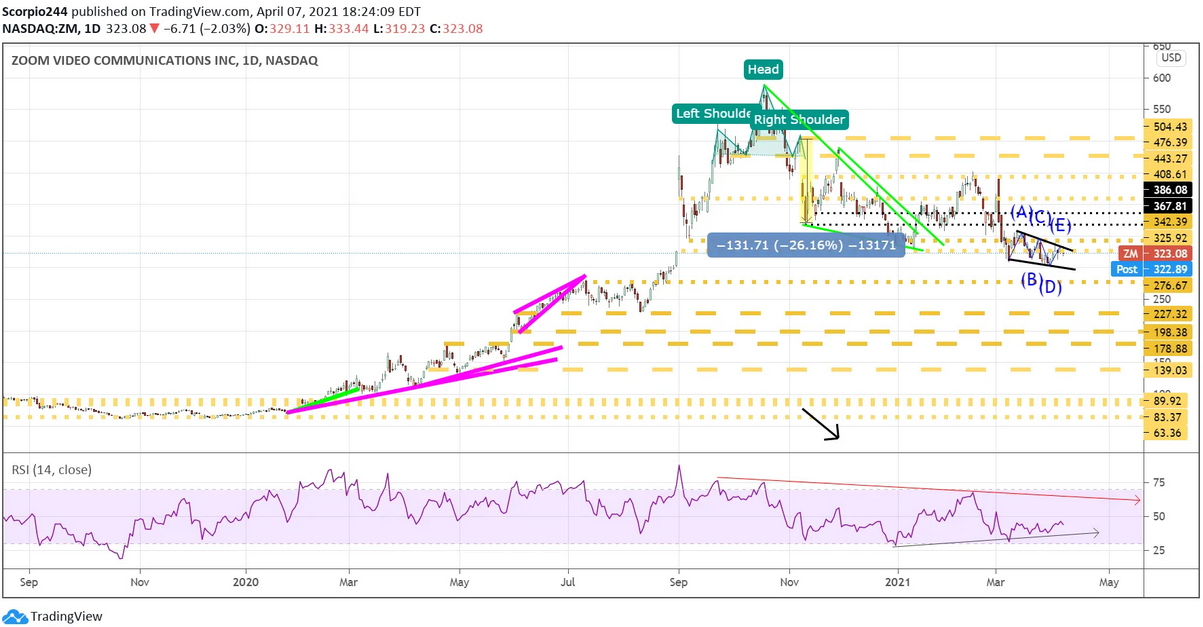
Zoom Video Inc Daily Chart

Boeing

Boeing (NYSE:BA) suddenly doesn’t look particularly strong. A drop below $252 sends it back to $239.
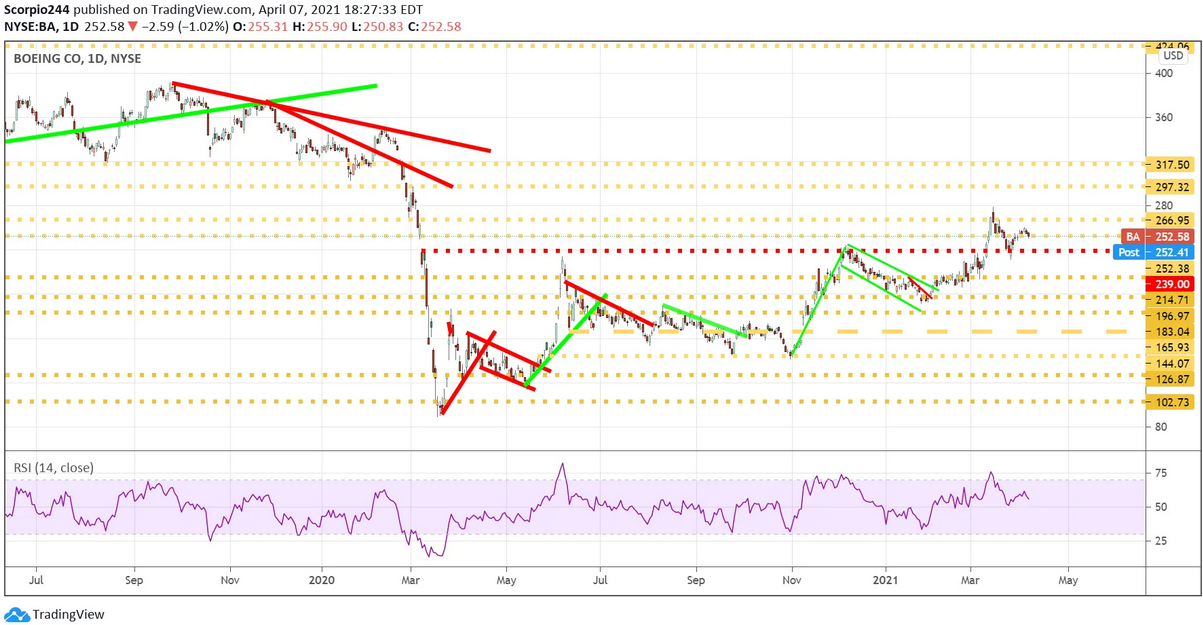
Boeing Co. Daily Chart

NVIDIA

It is going to be very interesting to see what happens to NVIDIA Corporation (NASDAQ:NVDA) when it reaches $575. I still don’t think you will see those all-times again anytime soon, and I get the sense that it won’t make it much past $575 either.
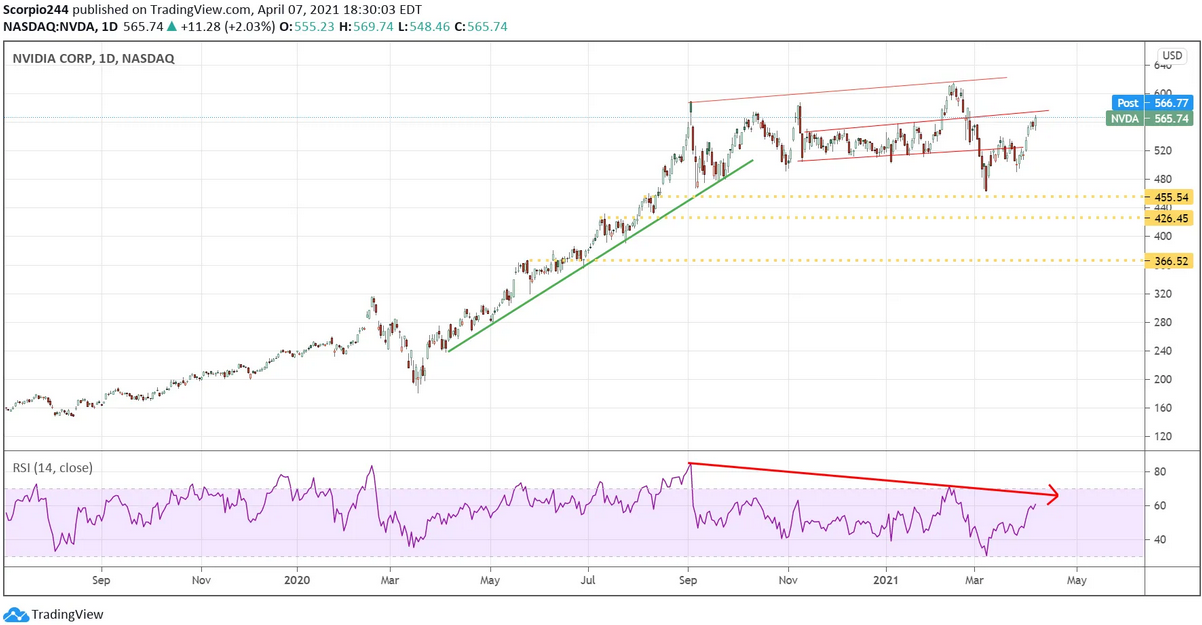
NVIDIA Corp Daily Chart

Have a good one

Original Post

Latest comments

thank s abound my friend
thank you for making things simple!
appreciate it as always! cheers!
Risk Disclosure: Trading in financial instruments and/or cryptocurrencies involves high risks including the risk of losing some, or all, of your investment amount, and may not be suitable for all investors. Prices of cryptocurrencies are extremely volatile and may be affected by external factors such as financial, regulatory or political events. Trading on margin increases the financial risks.
Before deciding to trade in financial instrument or cryptocurrencies you should be fully informed of the risks and costs associated with trading the financial markets, carefully consider your investment objectives, level of experience, and risk appetite, and seek professional advice where needed.
Fusion Media would like to remind you that the data contained in this website is not necessarily real-time nor accurate. The data and prices on the website are not necessarily provided by any market or exchange, but may be provided by market makers, and so prices may not be accurate and may differ from the actual price at any given market, meaning prices are indicative and not appropriate for trading purposes. Fusion Media and any provider of the data contained in this website will not accept liability for any loss or damage as a result of your trading, or your reliance on the information contained within this website.
It is prohibited to use, store, reproduce, display, modify, transmit or distribute the data contained in this website without the explicit prior written permission of Fusion Media and/or the data provider. All intellectual property rights are reserved by the providers and/or the exchange providing the data contained in this website.
Fusion Media may be compensated by the advertisers that appear on the website, based on your interaction with the advertisements or advertisers.
© 2007-2024 - Fusion Media Limited. All Rights Reserved.