Get 40% Off
👀 👁 🧿 All eyes on Biogen, up +4,56% after posting earnings. Our AI picked it in March 2024.
Which stocks will surge next?
Unlock AI-picked Stocks

Stocks And Bonds; Critical Change Of Direction In Play?

Published 03/27/2017, 08:45 AM
Updated 07/09/2023, 06:31 AM

Since the summer of 2016, stocks have done very well and bonds have been thumped, as rates have risen sharply. Is it time for these trends to take a break? Below compares the performance of the S&P 500, with the popular bond ETF iShares 20+ Year Treasury Bond (NASDAQ:TLT) over the past 9-months.
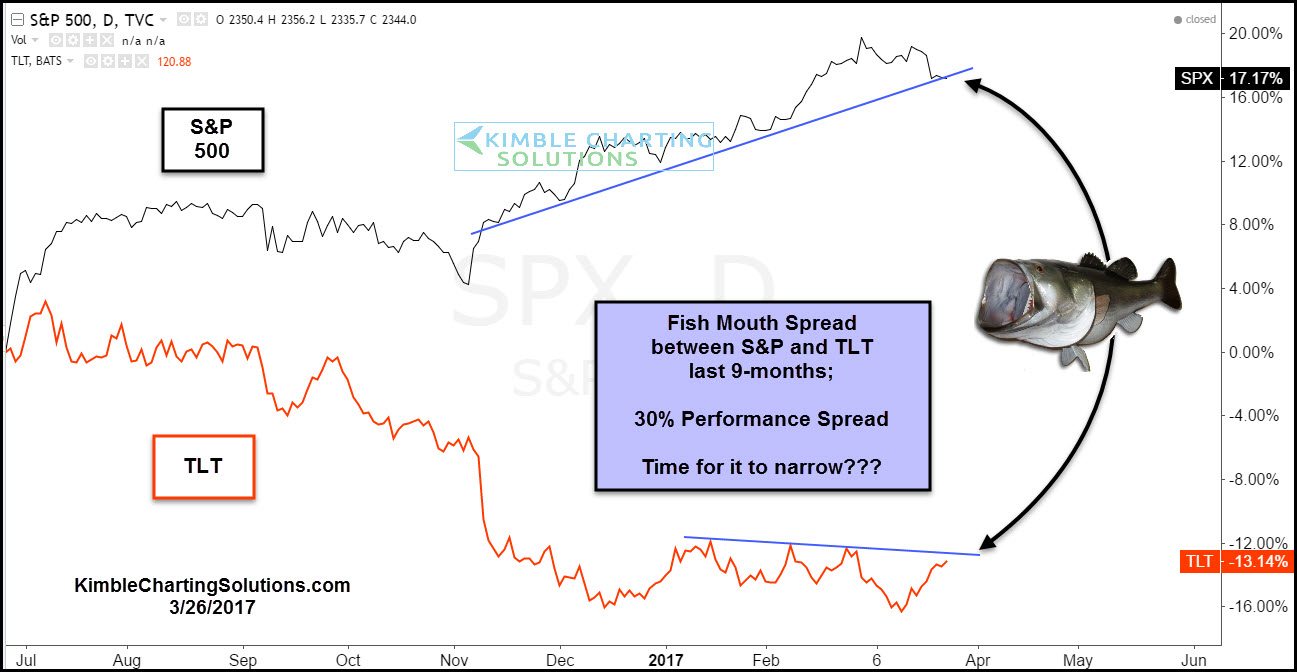
S&P And TLT Chart

The performance spread between stocks and bonds over the past 9-months is a big one! Rare to see the spread between the two being 30% in a 9-month time frame! If the S&P would happen to break support and TLT breaks resistance, the narrowing could begin. The following two charts check out what the Power of the Pattern looks like, for TLT and the S&P 500.

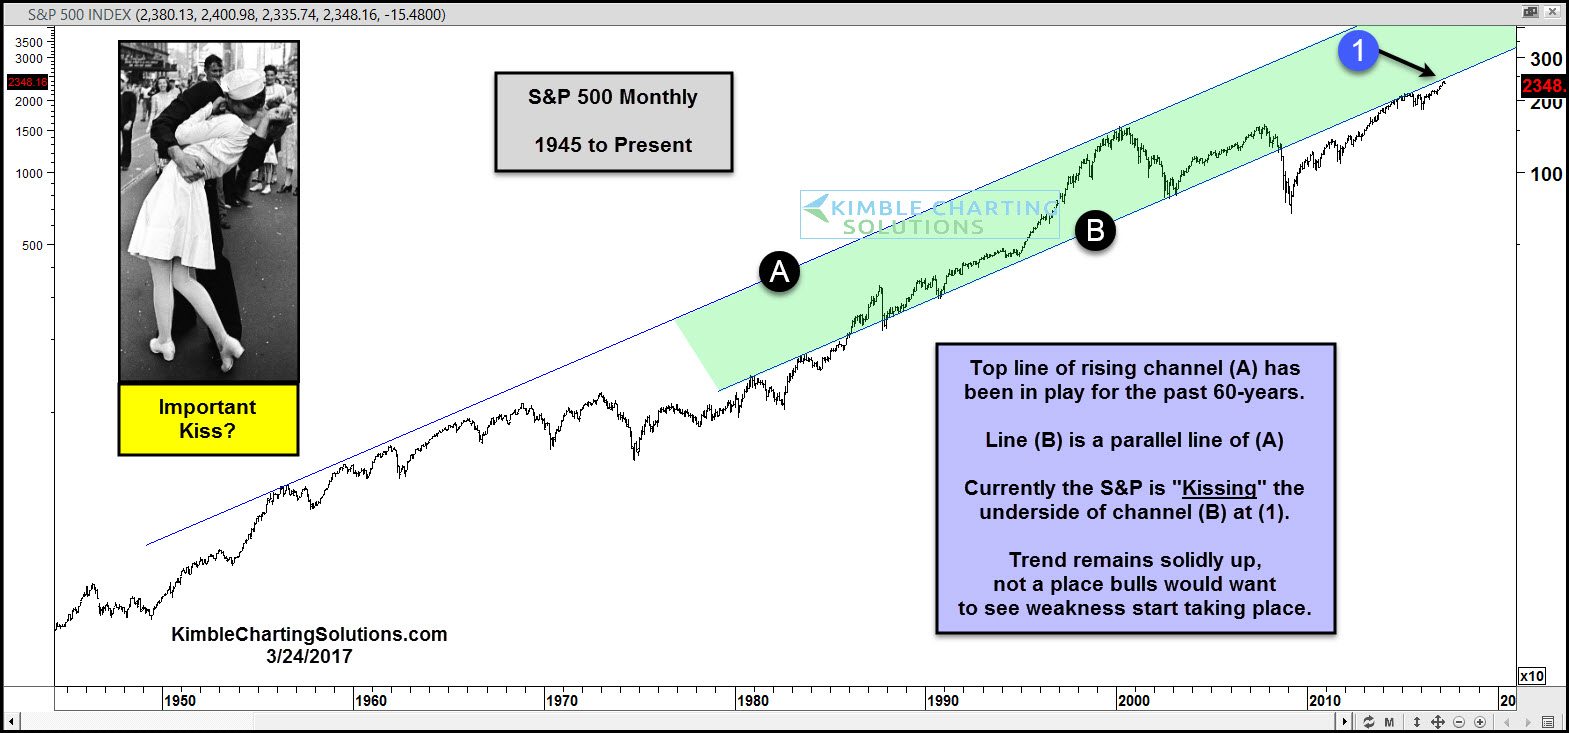
S&P 500 Monthly

First off lets be clear about this, the S&P 500 remains in a solid uptrend and is above its 200 day moving average and continues to make a series of higher lows and higher highs. Line (A) has been in place since the late 1950’s and was last touched back at the highs in 2000. Currently the S&P is kissing the underside of line (B) at (1), which is a parallel line of (A). This is a price point where the bulls wouldn’t care much to see selling pressure start taking place.

Below looks at the pattern of TLT over the past decade.

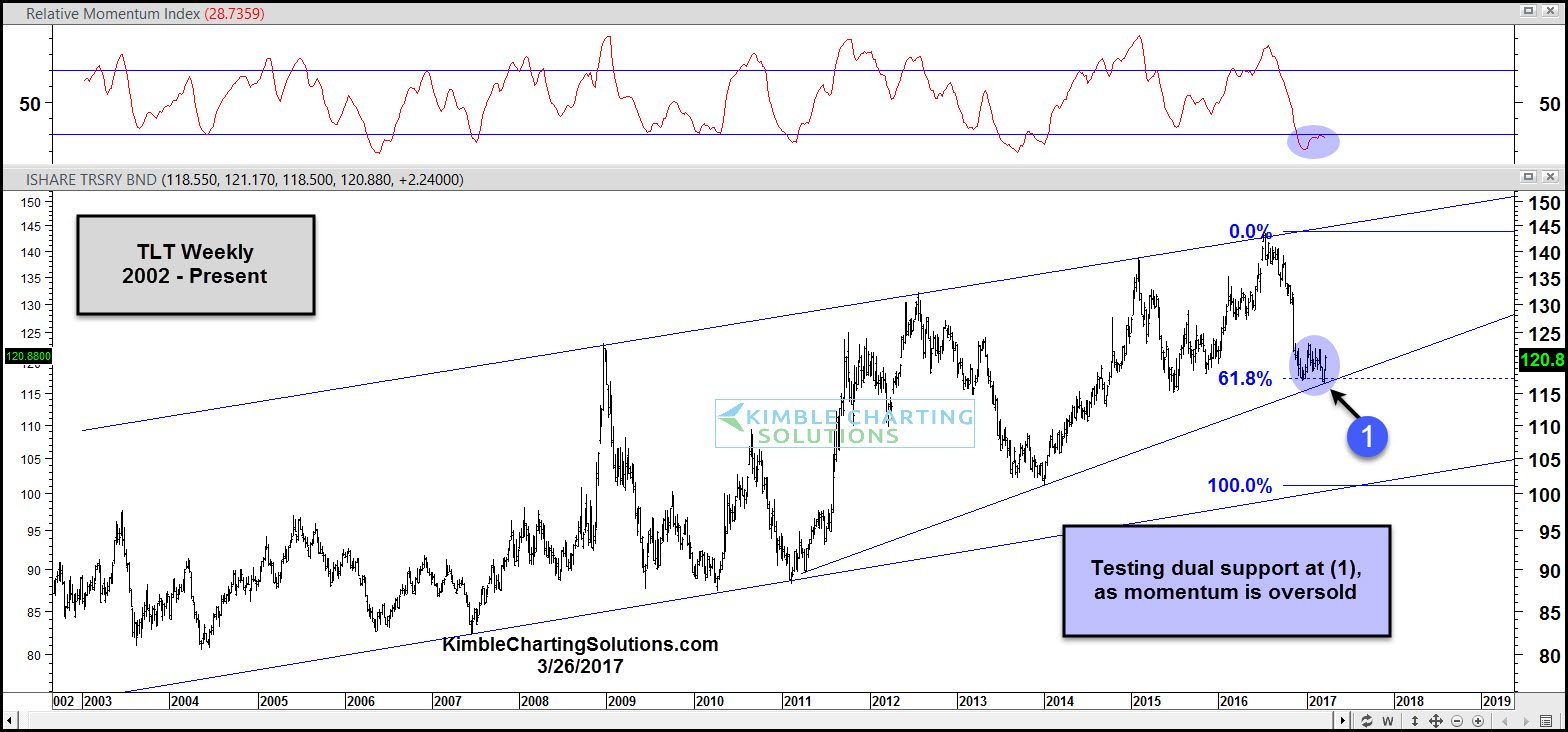
TLT Daily

TLT finds itself testing 6-year rising support and its 61% Fibonacci retracement level of the 2013 lows and 2016 highs at (1). Momentum is oversold and could be turning up.

3rd party Ad. Not an offer or recommendation by Investing.com. See disclosure here or remove ads .

The spread between stocks and bonds is very high in the top chart. If the S&P breaks support and TLT breaks above resistance, the large fish mouth spread could start a narrowing process. Joe Friday shared last week that fund flows to the S&P 500 are highest in years. (See Post Here). This is a setup that bulls would not want to see selling take place in the S&P, nor see weakness in Crude Oil continue!

Latest comments

Risk Disclosure: Trading in financial instruments and/or cryptocurrencies involves high risks including the risk of losing some, or all, of your investment amount, and may not be suitable for all investors. Prices of cryptocurrencies are extremely volatile and may be affected by external factors such as financial, regulatory or political events. Trading on margin increases the financial risks.
Before deciding to trade in financial instrument or cryptocurrencies you should be fully informed of the risks and costs associated with trading the financial markets, carefully consider your investment objectives, level of experience, and risk appetite, and seek professional advice where needed.
Fusion Media would like to remind you that the data contained in this website is not necessarily real-time nor accurate. The data and prices on the website are not necessarily provided by any market or exchange, but may be provided by market makers, and so prices may not be accurate and may differ from the actual price at any given market, meaning prices are indicative and not appropriate for trading purposes. Fusion Media and any provider of the data contained in this website will not accept liability for any loss or damage as a result of your trading, or your reliance on the information contained within this website.
It is prohibited to use, store, reproduce, display, modify, transmit or distribute the data contained in this website without the explicit prior written permission of Fusion Media and/or the data provider. All intellectual property rights are reserved by the providers and/or the exchange providing the data contained in this website.
Fusion Media may be compensated by the advertisers that appear on the website, based on your interaction with the advertisements or advertisers.
© 2007-2024 - Fusion Media Limited. All Rights Reserved.