- SPX Monitoring purposes; Covered 12/30/16 at 2238.83= gain .46%; Short on 12/29/16 at 2249.26.
- Monitoring purposes GOLD: Long GDX on 12/28/16 at 20.25.
- Long-Term Trend monitor purposes: Short SPX on 1/13/16 at 1890.28

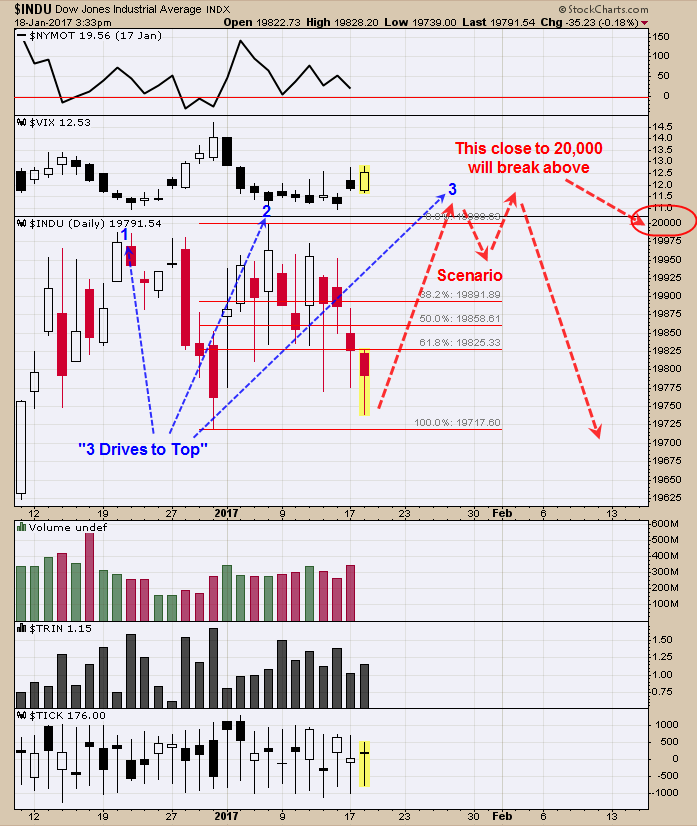
Our view of the market is going higher before going lower. The Dow Jones Industrial Average have been flirting with the 20,000 level for the last month and so far have not closed above that level. Usually when the market gets close to a round number it normally breaks above it and we expect that will happen here. The pattern forming on the Dow Jones is a possible “Three drives to Top”. The “Three Drives to Top” is identified by at least a 61.8% retracement off the second top on increased volume. This pattern appears fulfilled on the Dow Jones Industrials. The Dow Jones industrial shouldn’t break the previous of December 30, and if it does could change the reasoning. So far we don’t have a signal and will remain neutral. Covered 12/30/16 at 2238.83 = gain .46%; Short on 12/29/16 at 2249.26.

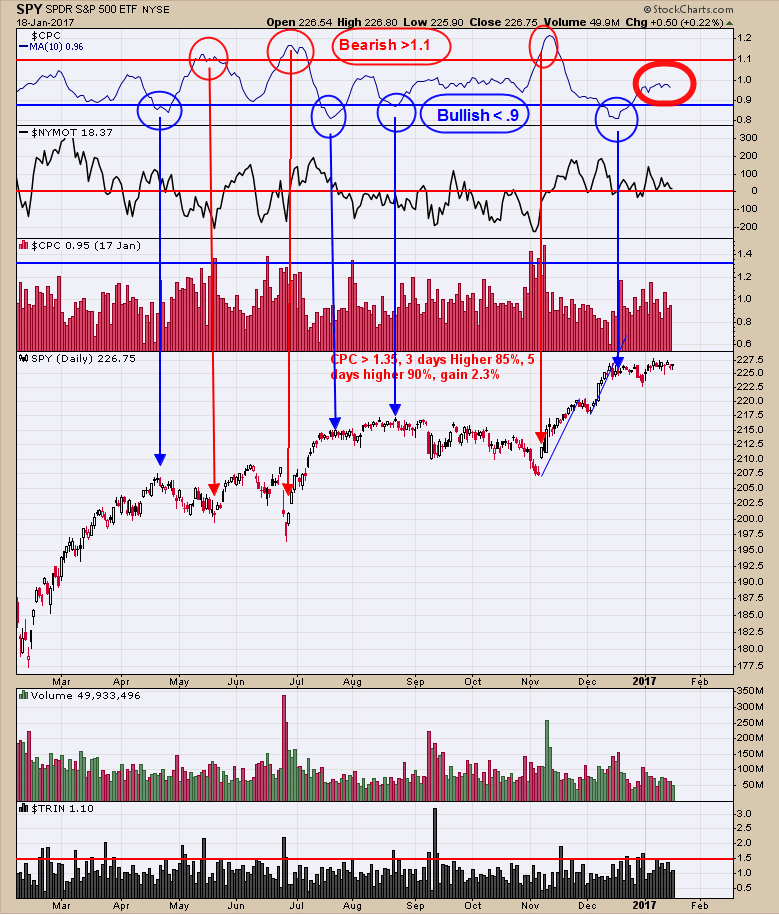
The top window is the CBOE Total Put/Call ratio (CPC). This ratio helps to identify tops when the 10 period moving average of this ratio rises above 1.10 (noted in red). This ratio also helps to identify bottoms when the 10 period moving average of CPC falls below .9. This ratio stands at .96 and smack in the middle between the bullish and bearish CPC level, and as yet not giving clues of what the next direction will be in the SPX. We also noticed that volume dropped in the SPX today showing traders are not taking sides long or short. The inauguration Friday appears will have an impact on the market and so far the Put/Call ratios are not showing what direction. With the NYSE McClellan Oscillator holding above “0” the direction could be up but the TRIN and TICK readings are not giving a clear signal. Staying neutral for now.

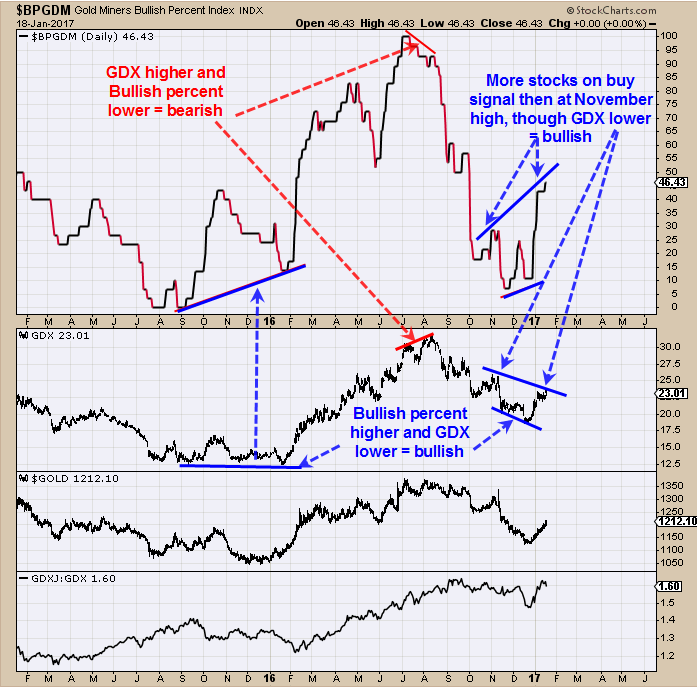
The chart above is the daily Bullish percent index for the Gold Miners index. The Bullish Percent index measures the percent of stocks in the Gold Miners index that are on Point and Figure buy signals. The rally from the December low on GDX has not broke above the previous high of November, but the Bullish Percent index has. This condition suggests at some point GDX will also break above the November high which comes in near 26.00. We also pointed out in the chart above the bullish divergences that where present at the January 2016 low where GDX broke a new low and bullish percent index made a much higher low. This bullish divergence also showed at the December 2016 low. A bearish divergence showed up at the August 2016 high. In general GDX should continue to move higher, possible for the next several months. Long GDX on 12/28/16 at 20.25.
