The global stock markets just turned from bad to worse last week. DOW suffered its worst week since the global financial crisis back in 2008, down the week by nearly -7%. S&P 500, down the month by -11.4%, is also on track to have its worst week since 1931, when it dropped -14.5%. Yen ended as the biggest winner on risk aversion. Australian Dollar led other commodity currencies as the weakest. Dollar, on the other hand, was mixed after Fed delivered a not that dovish rate hike. European majors might look strong, but that’s only because they’re not at the center of the storm.
There were many reasons cited for the global stock markets crash. Partial shut down of US government over Trump’s border wall could be a reason for late downside acceleration. But it’s after all a one-off event that’s repeated more than once. US-China trade war is on track to have a deal in late February or early March. Fed is often cited as a bearish factor. There were even rumors that Trump has discussed firing Fed Chair Jerome “Jay” Powell after last week’s hike. But as we argued below, investors have significantly pare back expectations on 2019 Fed hikes already. They’re now even unsure Fed will raise interest rates again in the first half. So, reducing bet on Fed hikes yet selling stocks sounds rather non-trivial.
Instead, we’ve mentioned multiple times, the clear move from stocks to bonds, in Germany, Japan and the US, indicates investors are clearly worried about slowdown or even recession. Germany 10 year bund yield closed at 0.25. That’s lowest level since the spike low at 0.186 in May. Excluding that one day spike, Germany 10 year yield closed at the lowest level since June 2017. Japan 10 year JGB yield dropped to as low as 0.014 before closing at 0.040. The low was the lowest since September 2017. And it hit as high as 0.166 just back in early October.
Fed delivered dovish rate hike, but was that dovish enough?
FOMC announcement last week was clearly a dovish shift overall. But, whether investors saw that as dovish enough, it’s another question. In short, Fed raised federal funds rate by 25bps to 2.25-2.50% as widely expected. The clearly dovish part is in the economic projections. Firstly, median longer run federal funds rate, which is see as Fed’s neutral, was revised down from 3.0% to 2.8%. For 2019, median federal funds rate was revised to 2.9%, down from 3.0%. Central tendency was revised to 2.5-3.0%, down from 2.8-30%. As we noted during the week, it suggested that Fed might only have one or at most two more rates hikes in 2019. That’s indeed echoed by New York Fed President John Williams’s comment that “something like two rate increases would make sense in a really strong economy going forward.”
In other projections, 2019 median growth projection was revised to 2.3%, down from 2.5%. 2020 median growth projection was unchanged at 2.0%. 2019 median unemployment rate projection was unchanged at 3.5%. But 2020 median unemployment rate projection was revised to 3.6%, up from 3.5%. 2019 median core PCE projection was revised to 2.0%, down from 2.1%. 2020 median core PCE projection was revised to 2.0%, down from 2.1%.
The not so dovish parts were that Fed maintained in the statement that “some further gradual increases” in federal funds rate will be consistent with sustaining the expansion and keeping inflation near target. Fed Chair Jerome Powell, while admitting that global growth is “softening”, also said “policy does not need to be accommodative” as the US economy continues to perform well.
Some commentators and analysts put the blame of the stock market crash on Fed. But judging from the reactions in fed fund futures, we believe markets have taken the dovish side of Fed already. And, we maintain that the fall in global stocks and treasury yields clearly indicated the worries on slowdown, or even recession. And in the highly interconnected world nowadays, trouble elsewhere doesn’t mean the US is winning. Eventually, the world moves together.
As of now, fed funds futures are pricing in only around 15% chance of a rate hike by 25bps to 2.50-2.75% in March. That’s sharply lower than 31% a week ago and 37% a month ago.
However about delaying the rate hike to June? Fed funds futures are pricing around 32% chance of only 1 hike in H1 to be delivered in June. That compares to 46% a week ago and 57% a month ago.
That means, investors are rather sure Fed won’t hike again in March. And they’re not even sure if Fed will hike again in first half. But stocks and long term treasury yields still tumbled?
US yield curves flattening accelerated, more downside at the long end
US treasury yields suffered quite notable decline while yield curve flattened rather seriously at the long end. 5-year yield dropped -0.087 over the week to 2.642. 10-year yield dropped -0.990 to 2.792. 30-year yield dropped -0.115 to 3.028. 30-year yield has indeed breached 3% handle too. Also yield curve is now inverted between 1-year (2.656) to 2-year (2.637) and 3 year (2.619).
10-year yield’s break of 2.808 support last week confirmed near term reversal on bearish divergence condition in daily MACD. Deeper fall expected to corrective the rise from 1.336, targeting 38.2% retracement of 1.336 to 3.248 at 2.517 (which is close to channel support at) 2.470. Given then federal funds rate target is now at 2.25-2.50%, such a “correction” is already enough to really “flatten” the yield curve.
More importantly, TNX was rejected by multi-decade channel resistance. From this perspective, TNX may dip further to 55 month EMA (now at 2.297) before bottoming. And this is not unreasonable even if our favored case of multi-decade bullish reversal is true.
Are global stocks correcting the uptrend from 2009 low?
S&P 500 took out 38.2% retracement of 1810.10 to 2940.91 at 2508.94 decisively last week. While the decline was expected, the power of it surprised us. For now, the base case is that fall from 2940.91 is only correcting the uptrend from 1810.10. While further fall is likely, downside should be contained around trend line support (now at around 2300), and above 61.8% retracement at 2242 to bring reversal.
The above mentioned support is also close to 55 month EMA (now at 2295.58). So, 2300 is likely the point we see buyer coming back. However, we’d like to point out that further fall to 38.2% retracement of 666.78 to 2940.91 at 2072.19 will mean that SPX is correcting the long term up trend from 2009 to 2018. That is, something more serious is underway.
Move across the Atlantic, German DAX has actually taken out equivalent support already. 55 month EMA (now at 11237.83) was firmly broken. Fall from 13596.89 is viewed as corrective the up trend from 3588.88 (2009 low ) to 13596.89 (2018 high). It’s targeting 38.2% retracement at 9773.83.
How about Japan? Nikkei is still holding well above 55 month EMA after last week’s steep decline. But same as DAX, bearish divergence condition is seen in monthly MACD, which is a sign of trend reversal. We’d wait and see if it can rebound from 55 day EMA. But similar to others, firm break there will suggests that it’s correcting the up trend from 2009 low of 6994.89 to 2018 high at 24448.07. 38.2% retracement at 17780.95 should then be targeted. And we’d like to point out that if that happens, with Japan and Germany in long term correction, US won’t be able to escape from it.
Still no breakout in Dollar index despite all volatility
Now, let’s have a look at the Dollar index. It’s still holding on to 4 hour 55 day EMA, and stayed well above 95.67 support despite all the volatility. Near term outlook remains bullish. But risks of reversal is high considering bearish divergence condition in daily MACD. It’s also in proximity to 61.8% retracement of 103.82 to 88.25 at 97.87. It will probably take some more time before the index commit to a direction. Break of 95.67 will be an early sign of rejection of 97.87 key fibonacci resistance. Meanwhile, sustained break of 97.87 will confirm up trend extension. But in the latter case, it’s unlikely to be driven by US yields, but risk aversion.
Position trading – EUR/JPY finally falls as expected
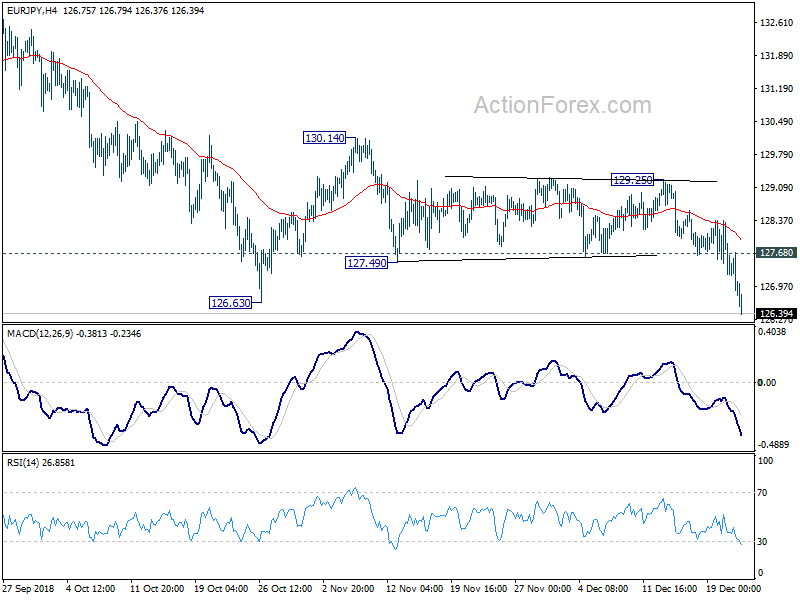
We’re holding on to EUR/JPY short (entered at 127.80, stop at 129.30) as last updated here. After holding the position for nearly a month, it’s finally playing out as we expected. EUR/JPY’s break of 126.63 support confirms resumption of decline from 133.12. It’s held all the way by falling 55 day EMA which affirms bearishness.
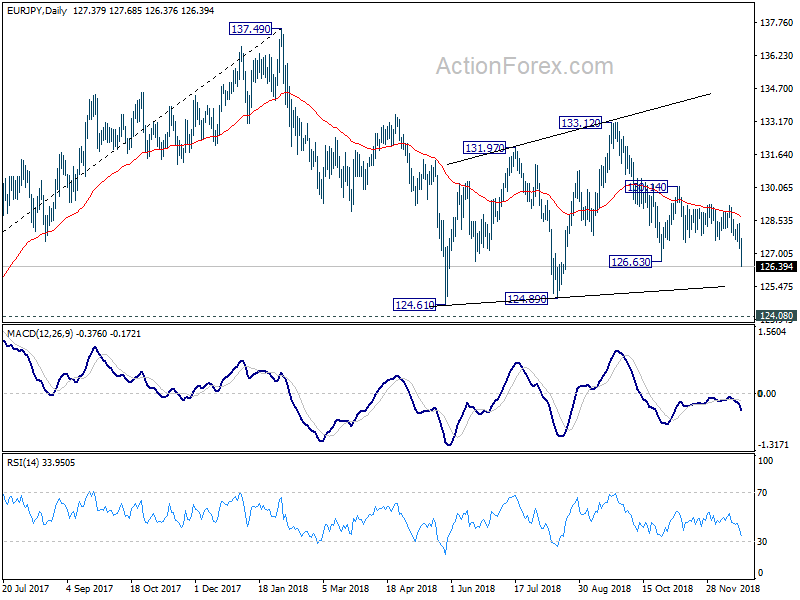
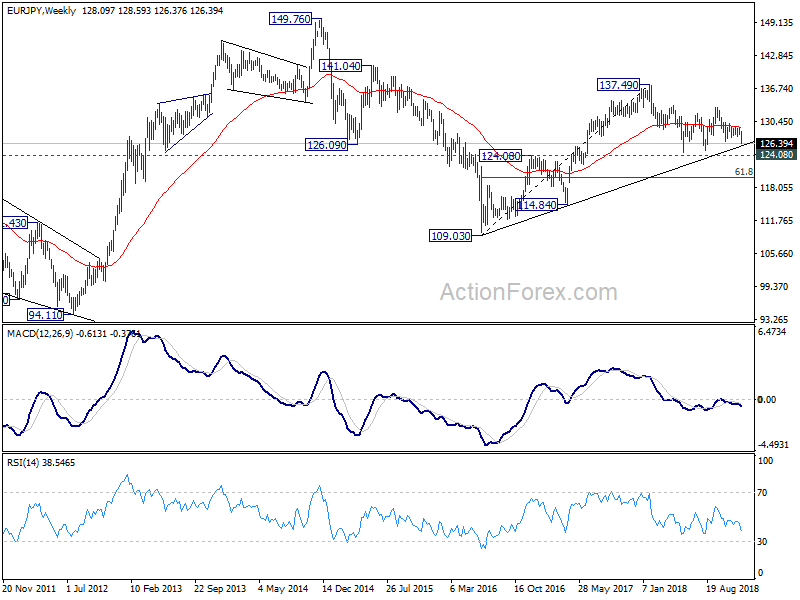
In the bigger picture, EUR/JPY is also held below 55 week EMA which is an indication of medium term bearishness too. Further decline should be seen to 124.08/89 support zone. envisaging the fall from 137.49 to resume eventually and extend to 61.8% retracement of 109.03 to 137.49 at 119.90. But we’ll pay attention to the reaction from 124.08/89 support zone to decide whether to get out early or not. .
Going forward, we’ll hold short in EUR/JPY and lower the sop to 127.70, slightly above 127.68 minor resistance. Target (NYSE:TGT) is put at 120.00 for now. We’ll hold off from other trades for now before new year.