
Wednesday's trading session was overall bullish, as the main stock market indexes closed between -0.3% and +0.3% vs. their Tuesday's closing prices following much lower opening in reaction to Gary Cohn's resignation's news. The S&P 500 index closed virtually flat after bouncing off support level at 2,700. It currently trades around 5% below January 26 record high of 2,872.87. The Dow Jones Industrial Average lost 0.3%, and the technology Nasdaq Composite gained 0.3% on Wednesday.
Technical outlook of the S&P 500 index remains unchanged. The nearest important level of resistance is at around 2,730, marked by recent local highs. The resistance level is also at 2,740-2,750, marked by Fibonacci's 61.8% retracement of the late January - early February move down at 2,742.92. On the other hand, support level is at 2,690-2,700. The support level is also at 2,650-2,660, marked by last week's local low.
The S&P 500 index reached its record high on January 26. It broke below month-long upward trend line, as it confirmed uptrend's reversal. Then the broad stock market gauge retraced all of its January rally and continued lower. The index extended its downtrend on February 9, as it was almost 12% below the late January record high. We can see that stocks reversed their medium-term upward course following whole retracement of January euphoria rally. Then the market bounced off its almost year-long medium-term upward trend line, and it retraced more than 61.8% of the sell-off within a few days of trading. Is this just an upward correction or uptrend leading to new all-time highs? The market seems to be in the middle of two possible future scenarios. The bearish case leads us to February low or lower after breaking below medium-term upward trend line, and the bullish one means potential double top pattern or breakout above the late January high. However, the most likely scenario may be that stocks go sideways for a while:

Mixed Expectations So Far
Expectations before the opening of today's trading session are mixed or virtually flat, because the index futures contracts trade between -0.2% and +0.3% vs. their yesterday's closing prices. The European stock market indexes have been mixed so far. Investors will wait for tomorrow's monthly jobs data release, but we will see some economic data announcements today: Challenger Job Cuts number at 7:30 a.m., Initial Claims at 8:30 a.m. There will also be the ECB Press Conference at 8:30 a.m. Will the market break above its short-term consolidation today? Probably not by much. We may see some more uncertainty following Friday-Monday's advance.
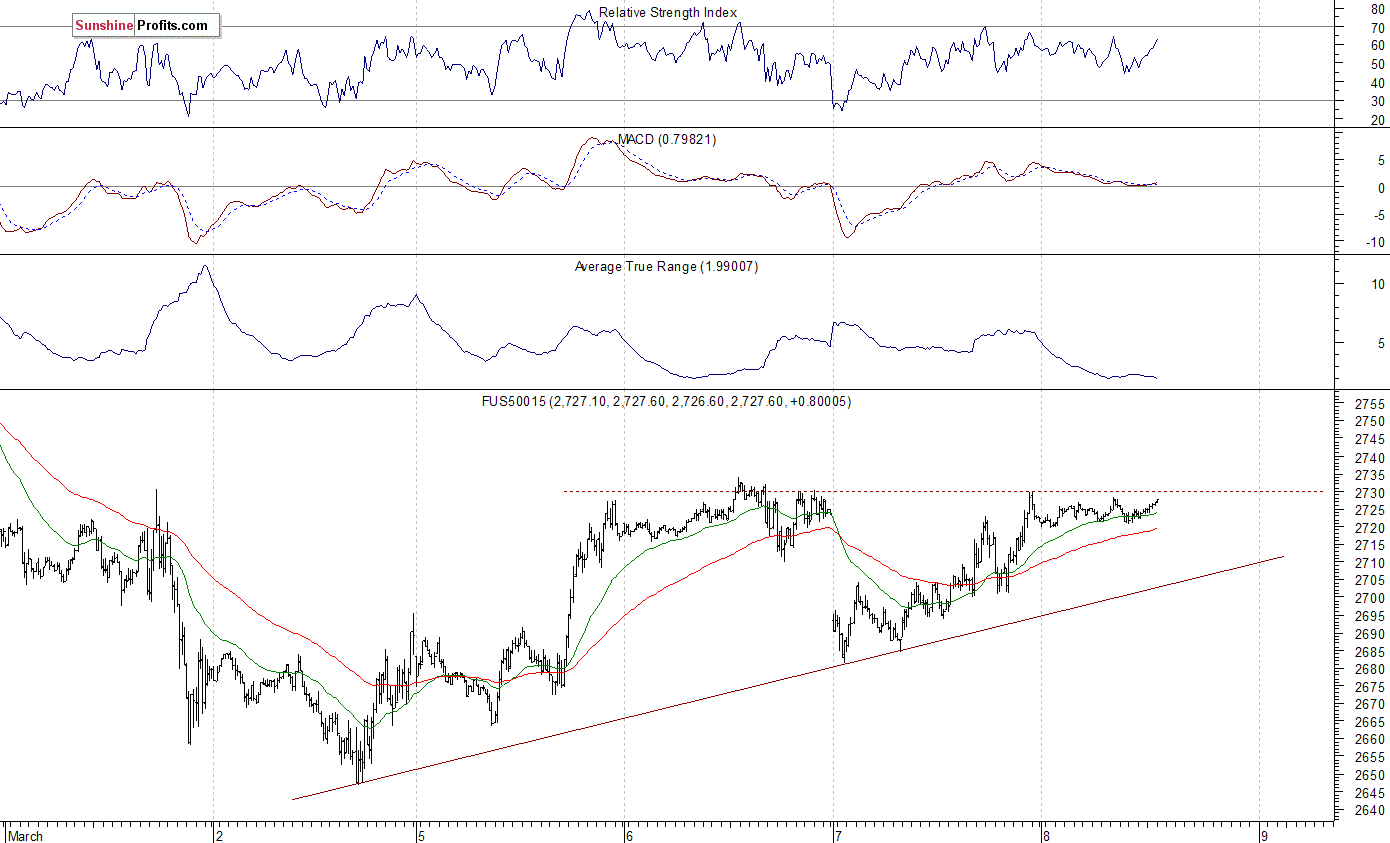
The S&P 500 futures contract is within an intraday consolidation after yesterday's intraday move up. The market remains close to resistance level of 2,730, marked by recent local highs. If it breaks higher, it could continue to the next level of resistance at 2,750-2,760, marked by late February short-term consolidation. On the other hand, support level remains at 2,680-2,700, marked by yesterday's overnight consolidation. The futures contract remains above its week-long upward trend line, as we can see on the 15-minute chart:
Nasdaq Relatively Stronger
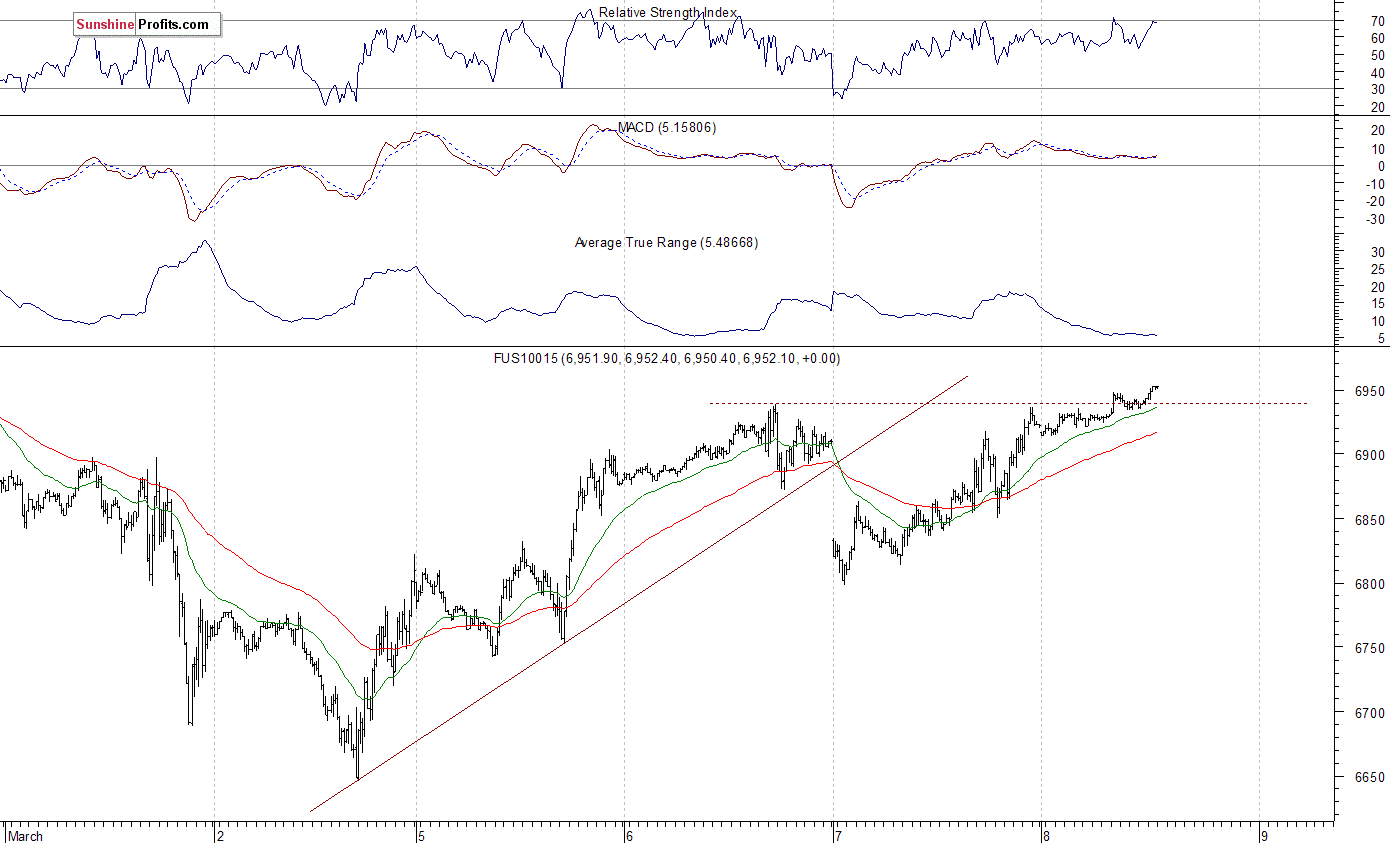
The technology Nasdaq 100 futures contract is relatively stronger, as it extends its yesterday's move up. The market trades above the level of 6,940. Potential resistance level is at around 6,970-7,000, marked by some previous fluctuations. On the other hand, level of support is at 6,900, among others. The market retraced more of its recent rally last week. A rally that retraced most of its severe late January - early February decline. Then it bounced off Friday's local low, and retraced some of its last week's decline. Will it continue towards recent local highs above 7,000 mark? Tech stocks remain relatively stronger than the broad stock market recently. The Nasdaq futures contract is breaking above its recent local high:
Amazon Hits New Record High While Apple (NASDAQ:AAPL) Falters
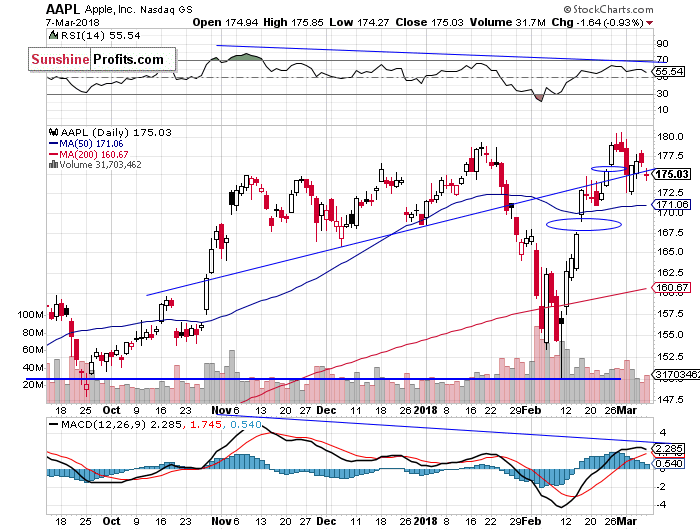
Let's take a look at Apple, Inc. stock (AAPL) daily chart (chart courtesy of http://stockcharts.com). It was one of February stock market rout's main drivers. Then it led broad stock market rebound rally. It fell close to support level of $150 on February 9. Since then it was retracing its early February losses. The market reached new record high a week ago, as it was trading above $180 mark again. Then it reversed its advance. On Friday it continued lower but then it bounced off support level of $172.50 again. The price continues to trade within a short-term consolidation:
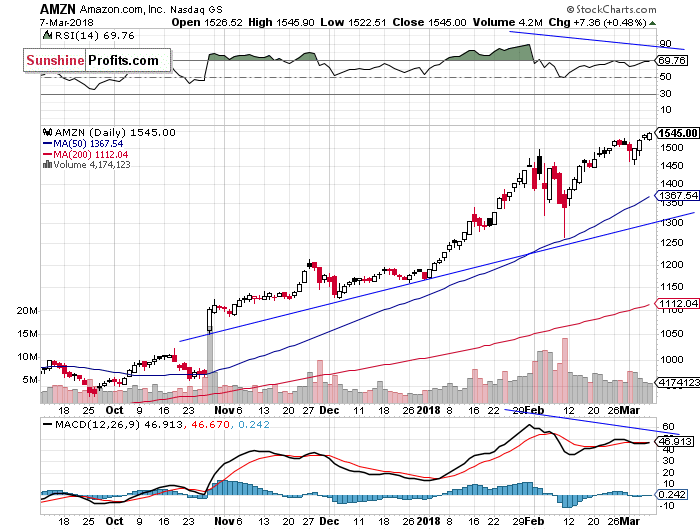
Amazon.com, Inc. stock (NASDAQ:AMZN) reached another new record high yesterday, as it extended its gains above $1,500 mark. The stock continues to trade well above its end of year closing price of $1,167.5. AMZN bounced off its upward trend line a month ago following downward correction below the price of $1,300. We can see some negative technical divergences along with overbought conditions, but the stock is still remarkably stronger than the broad stock market:
Dow Jones Struggles at 25,000 Mark
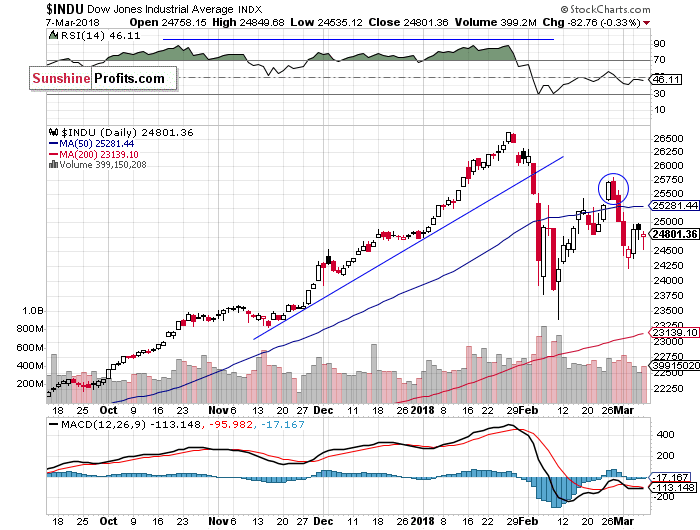
The Dow Jones Industrial Average daily chart shows that blue-chip index reversed its three-week-long rally from February 9 low. The market broke above the resistance level of around 25,500 over two weeks ago, but it failed to continue higher. We saw potential negative candlestick pattern called Dark Cloud Cover. It is a pattern in which the uptrend continues with a long white body, and the next day it reverses following higher open and closes below the mid-point between open and close prices of the previous day. This negative downward reversal pattern has been confirmed. Consequently, the index broke below 25,000 mark. Since then, it was retracing some of this decline, but it remained relatively weaker than the broad stock market last week. Will it break above 25,000 mark again? It currently trades just below that resistance level:
Concluding, the S&P 500 index closed virtually flat on Wednesday, after opening 0.7% lower in reaction to Gary Cohn's resignation news. The market was overall bullish yesterday, despite remaining within its short-term consolidation. Is this just a flat correction of Friday-Monday's move up? It looks so. However, we may see some more uncertainty ahead of tomorrow's monthly jobs data release.
The broad stock market was falling almost 12% off its late January record high on February 9 before an intraday reversal. It was a final panic selling ahead of short-term upward reversal, and the market found a support of its medium-term upward trend line, which was at 2,550. The S&P 500 index retraced its whole month-long January rally and fell the lowest since early October. Then it retraced more than 61.8% of this relatively quick and deep sell-off. So, medium-term picture is now neutral. Investors took profits off the table following the unprecedented month-long rally, but then they began selling in panic. It was quite similar to 2010 Flash Crash event. This sell-off set the negative tone for weeks or months to come, despite recent broad stock market rebound.