
**NEW** As part of the ongoing process to offer new and up-to-date information regarding seasonal and technical investing, we are adding a section to the daily reports that details the stocks that are entering their period of seasonal strength, based on average historical start dates. Stocks highlighted are for information purposes only and should not be considered as advice to purchase or to sell mentioned securities. As always, the use of technical and fundamental analysis is encouraged in order to fine tune entry and exit points to average seasonal trends.
Stocks Entering Period of Seasonal Strength Today:
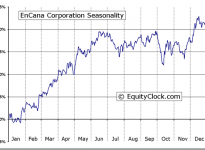
EnCana Corporation (NYSE:ECA) Seasonal Chart
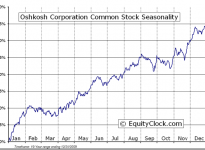
Oshkosh Corporation (NYSE:OSK) Seasonal Chart
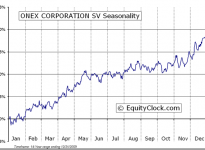
ONEX Corporation (TO:OCX) Seasonal Chart
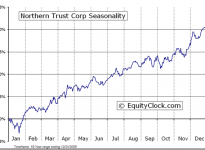
Northern Trust Corporation (NASDAQ:NTRS) Seasonal Chart
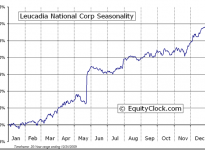
Leucadia National Corp. (NYSE:LUK) Seasonal Chart
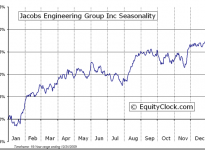
Jacobs Engineering Group Inc. (NYSE:JEC) Seasonal Chart
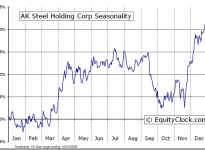
AK Steel Holding Corporation (NYSE:AKS) Seasonal Chart
The Markets
Stocks ended lower on Wednesday as investors reacted to the release of the minutes from the latest FOMC meeting. Despite noting that market expectations for the first increase in the federal funds rate “was pushed out from the third quarter of 2015 to late 2015,” few clues were offered as to the precise timeframe in which tightening would occur. The minutes expressed concern about the near-term decline in inflation below the committee’s 2% goal as a result of the decline in energy prices, which may persist for some time. However, the committee anticipates that inflation will trend towards its 2% target over the longer-term. Inflation expectations remain a key variable in the Fed’s dual mandate that may alter the committee’s readiness to increase rates over the next six to twelve months, given that these expectations may be providing a better gauge of demand for people, materials, and product in the economy. Looking at inflation expectations via the Treasury Inflation Protected ETF (TIP) relative to the 7-10 year Treasury Bond Fund (ARCA:IEF), the ratio is testing long-term support, having recorded significant declines since 2011 when QE2 concluded. The latest quantitative easing program clearly did not have the same impact as the first two, leaving the Fed’s hands tied from any immediate action. Further declines in inflation below levels of support could lead to a test of levels last seen in 2009, potentially destabilizing the economic recovery as investors lose faith in the central bank. Momentum indicators for the ratio between the Inflation Protected fund and the Intermediate T-Bond Fund recently rebounded from the most oversold levels since 2009, possibly suggesting short-term downside exhaustion. Inflation expectations are often important in fuelling commodity market trends, particularly Gold, which is also trying to find a footing around present levels. Inflation seasonally declines in the last quarter of the year.

While on the topic of commodities, Natural Gas prices surged on Wednesday as investors bet on cold winter weather given the deep freeze that is covering large parts of the US and Canada. The price of the commodity is once again attempting to break and hold above its 200-day moving average, benefitting from positive seasonal influences that typically begin in September. The seasonal trend peaks in December, just as the winter season officially begins. The 50-day moving average of the energy commodity recently curled higher, suggesting an emerging positive intermediate trend, which, if it holds, should allow for higher prices through the remainder of the period of seasonal strength. Support is apparent at this intermediate average.

 Seasonal Chart")
Stocks have achieved an unprecedented rally since the October low, a rebound more akin to significant market bottoms, such as March of 2009. The strength of the rebound has fuelled gains for the S&P 500 Index above its 5-day moving average for 24 sessions, the longest stretch in over 20 years. Twenty-four trading sessions exceeds the previous longest timespan over the last two decades of 23 days, which ran between June 17 to July 20 of 1998 and another that ran between October 30 to December 2 of 1996. The conclusion to the rally on July 21st of 1998 led to a correction of over 20% during the months that followed, while the rally that ended on December 3 of 1996 led to a correction of around 5%, which lasted only a couple of weeks. Looking back even further, the recent rally is just the fourth time in the past 60 years that the large-cap benchmark has held above this short-term moving average for at least 24 trading days. The record remains at 26 trading days, which ran between January 24 and March 3 of 1986. As of Wednesday’s close, the 5-day average sat at 2044.20, a break of which would likely be the first step in a retracement of the month-old advance in equity prices.


Sentiment on Wednesday, as gauged by the put-call ratio, ended bullish at 0.93.

Seasonal charts of companies reporting earnings today:


S&P 500 Index


TSE Composite


Horizons Seasonal Rotation ETF (TO:HAC)
- Closing Market Value: $14.99 (down 0.07%)
- Closing NAV/Unit: $15.00 (up 0.28%)
Performance*
| 2014 Year-to-Date | Since Inception (Nov 19, 2009) | |
| HAC.TO | 4.90% | 50.0% |
* performance calculated on Closing NAV/Unit as provided by custodian
