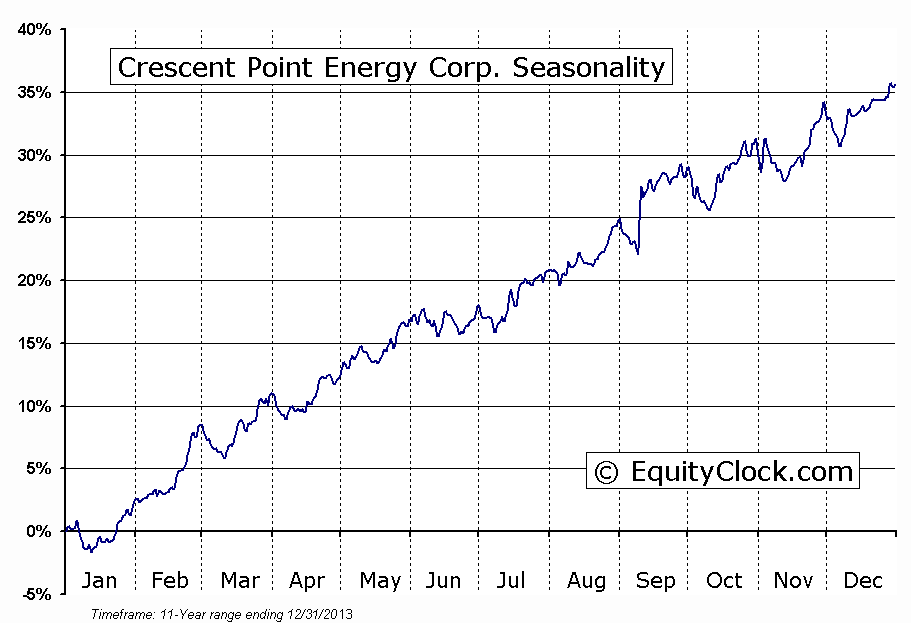
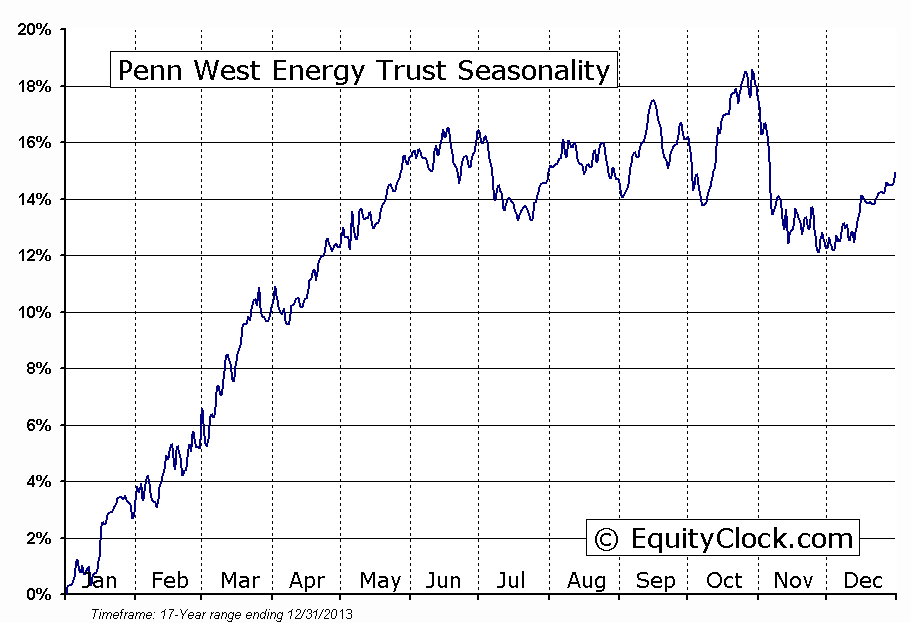
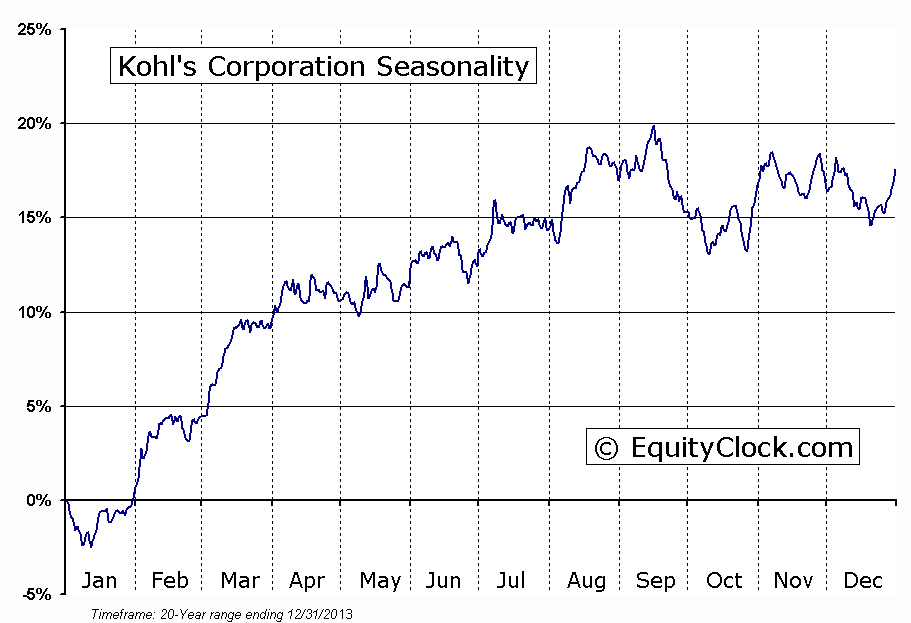
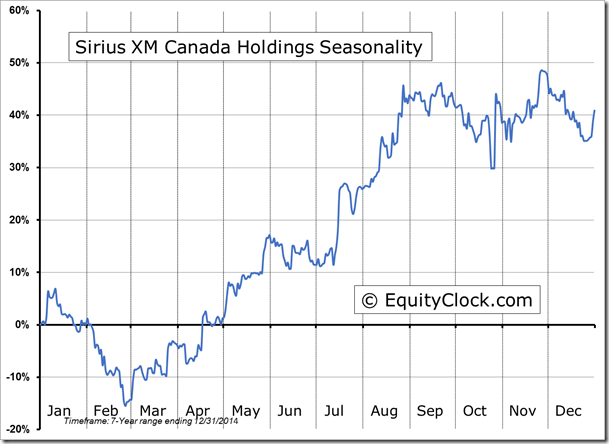
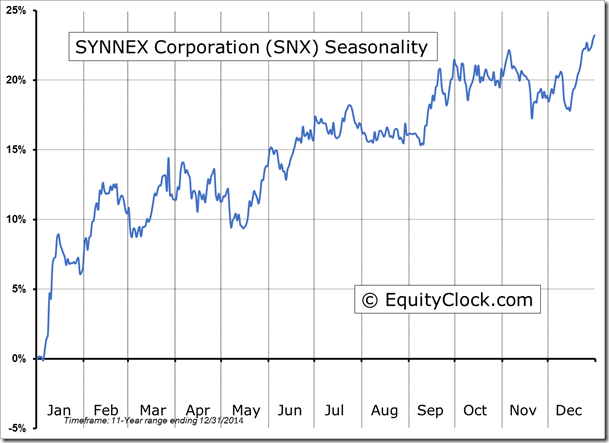
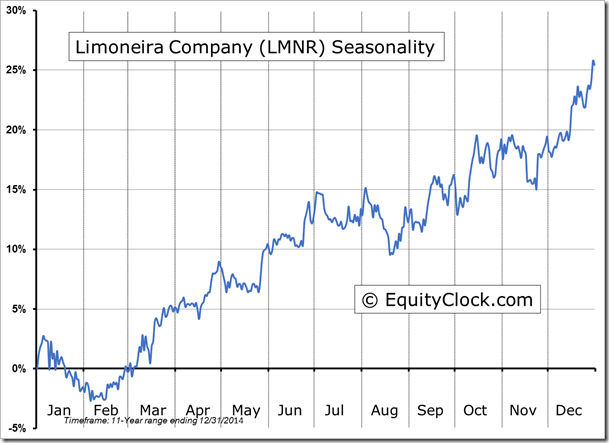
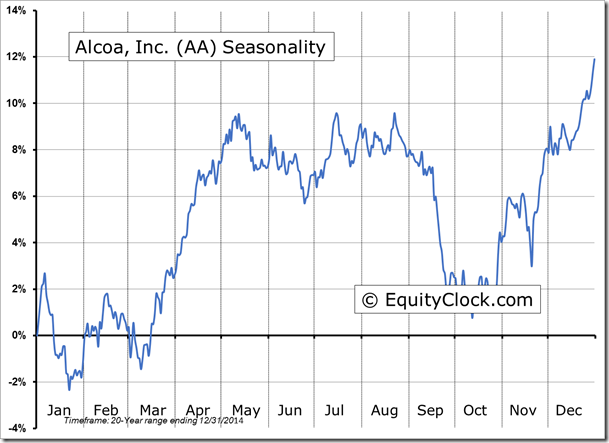
Stocks Entering Period of Seasonal Strength Today:
Crescent Point Energy Corp.:CPG Seasonal Chart
Penn West Petroleum :PWT Seasonal Chart
Kohl’s Corporation KSS Seasonal Chart
The Markets
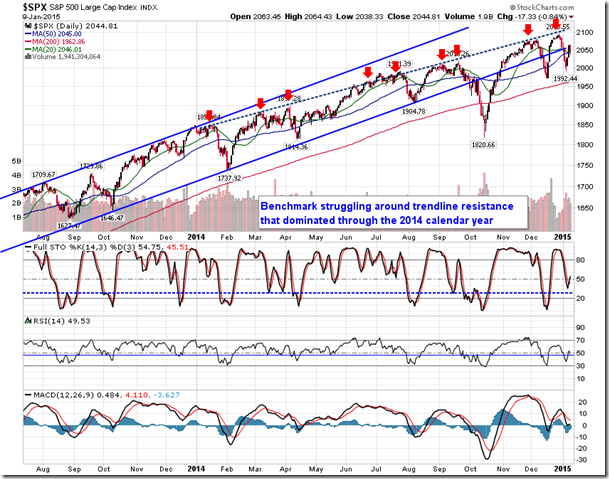
Stocks ended lower on Friday as investors reacted to the employment report for the month on December. The number of new payrolls added for the month was a better than expected 252,000, down from the 353,000 added last month, but still showing healthy economic growth. The number that had investors concerned was the average hourly wages, which ticked lower by 0.2% for the month.
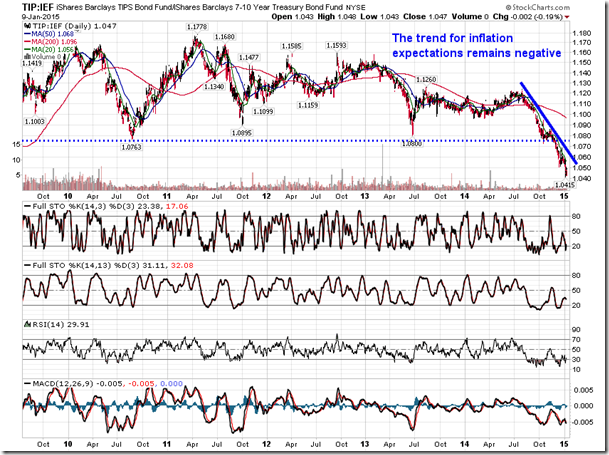
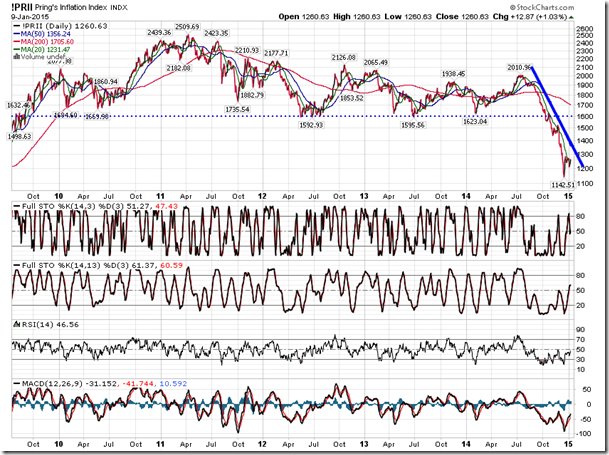
Over the past year, hourly earnings have risen a mere 1.65%, inline with the pace of inflation, implying that real wage growth was absent. Inflation remains the key variable that has investors concerned. In Europe, the threat of deflation remains a probable outcome. Back in the US, inflation, as gauged by the Consumer Price Index (CPI), remains stubbornly low, well below the 2% objective set by the Fed. Looking at the Treasury Inflation Protected ETF (ARCA:TIP) relative to the 7-10 Year Treasury Bond Fund (ARCA:IEF), inflation expectations continue to trend lower, following the direction of commodity prices, mainly oil. Pring’s Inflation Index, which seeks to replicate a group of stocks that are sensitive to inflationary conditions, is showing a similar declining trend.
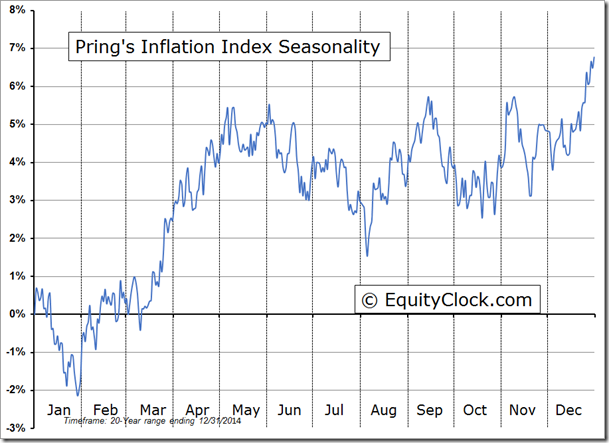
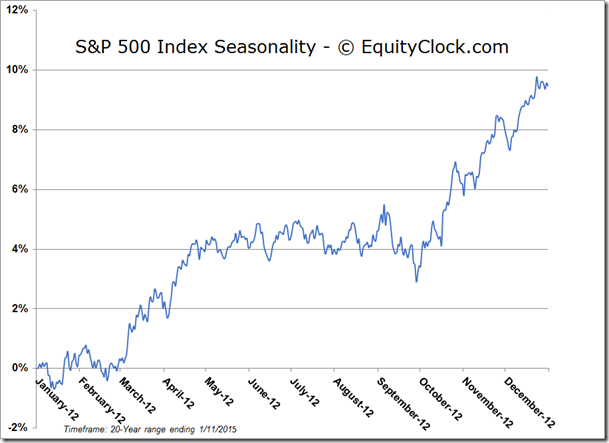
A seasonal analysis on this index shows that inflationary pressures start to pick up at the end of January, running through to May, thanks to the seasonal rise in energy commodities. Evidence of a bottoming pattern in the price of oil and energy stocks continues to be sought ahead of the period of seasonal strength, which could get underway at any time now.
Declining inflation expectations and a rising US dollar continues to threaten the commodity market over the near-term, however, a couple of metal commodities are showing signs of a base building pattern within their period of seasonal strength.
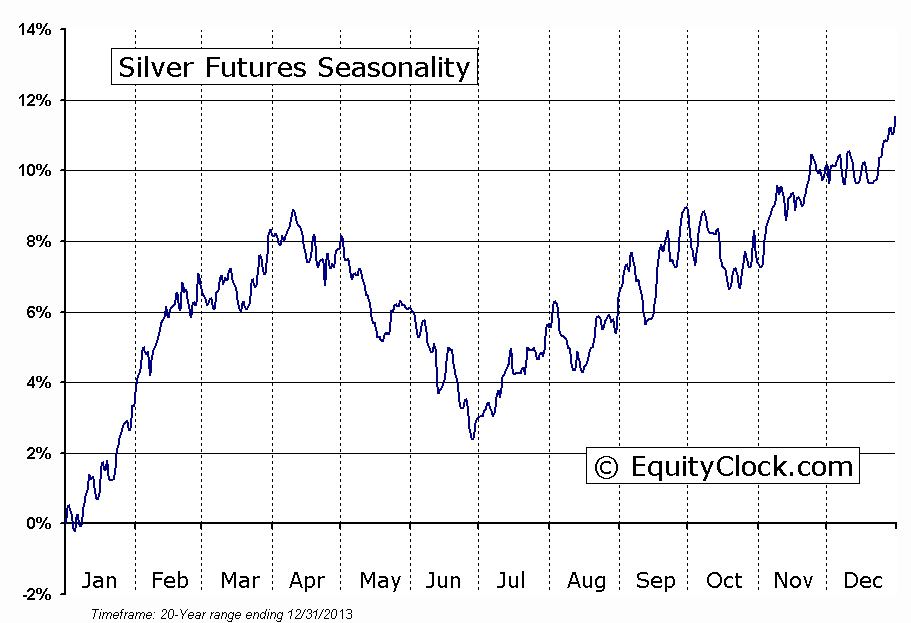
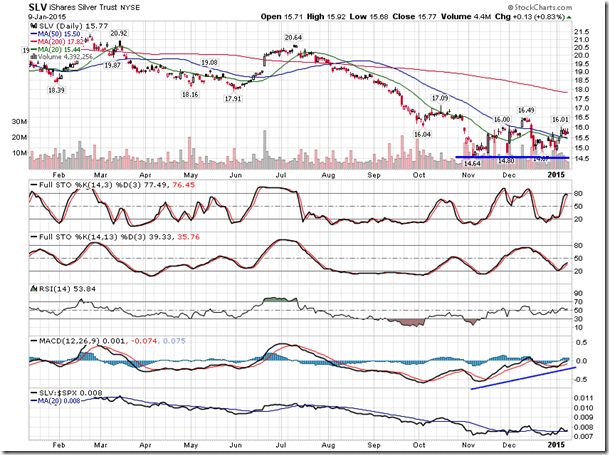
With the recent volatility in equity markets, Silver and Platinum have began to stabilize, attempting to halt the downward trend in prices that saw significant losses since July of last year. A double-bottom with respect to the price of Silver may be becoming apparent.
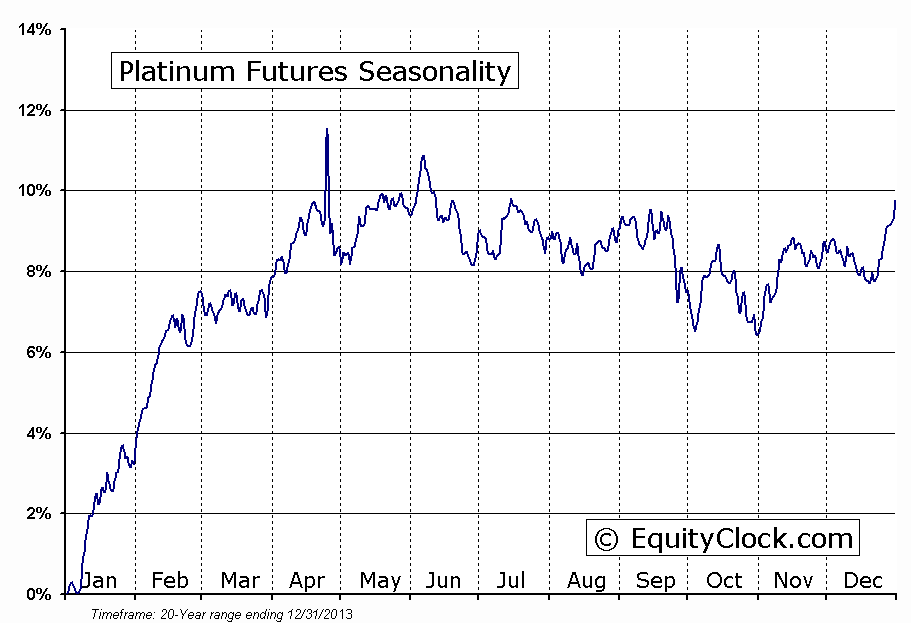
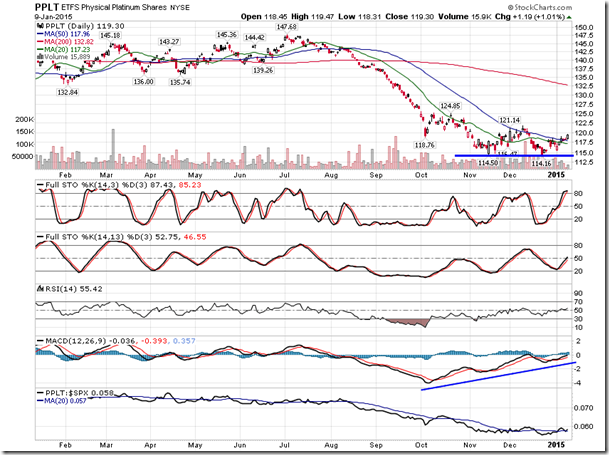
Looking at the Silver ETF (ARCA:SLV), support at $14.64 has held for the past couple of months; a break above short-term resistance of $16.49 would imply a new intermediate uptrend. A similar pattern is evident on the chart of the Platinum ETF (NYSE:PPLT), which has held support around $114. Both Silver and Platinum remain seasonally strong through to a least the end of February, benefiting from the uptick in industrial production ahead of the spring.
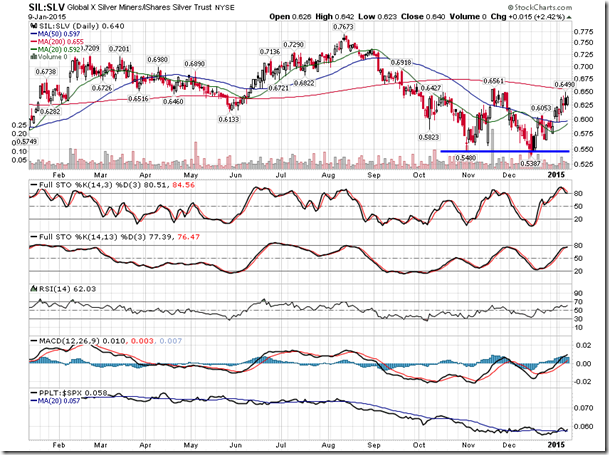
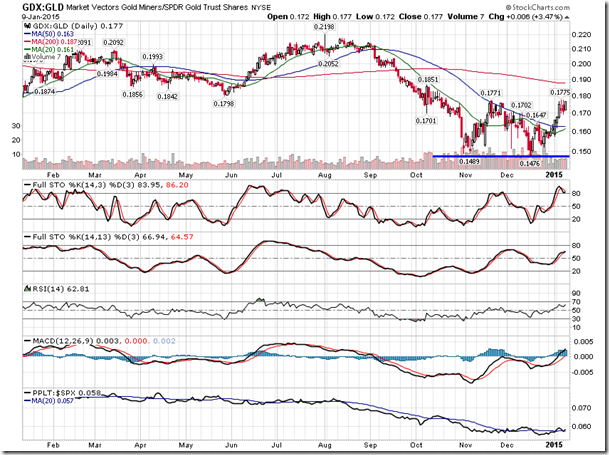
Typically, as investors become confident that a tradable low in commodity prices has been charted, the stocks of the producers start to outperform. The chart of the Silver Miners ETF (NYSE:SIL) versus Silver (SLV) is showing a similar double-bottom pattern as the producers show strength relative to the commodity. The chart of the Gold Miners ETF (ARCA:GDX) versus the price of Gold (ARCA:GLD) is showing the same, suggesting that miners of these precious metals, whether it be Gold, Silver, or Platinum, are setup for a move higher, with the expectation that the commodities will do the same. The miners remain in a period of seasonal strength through February, similar to the commodities.
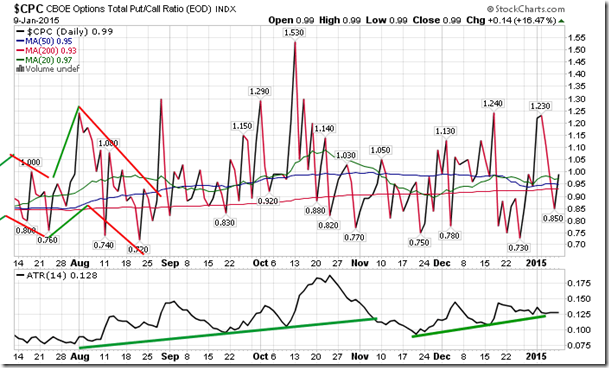
Sentiment on Friday, as gauged by the put-call ratio, ended close to neutral at 0.99.
Seasonal charts of companies reporting earnings today:
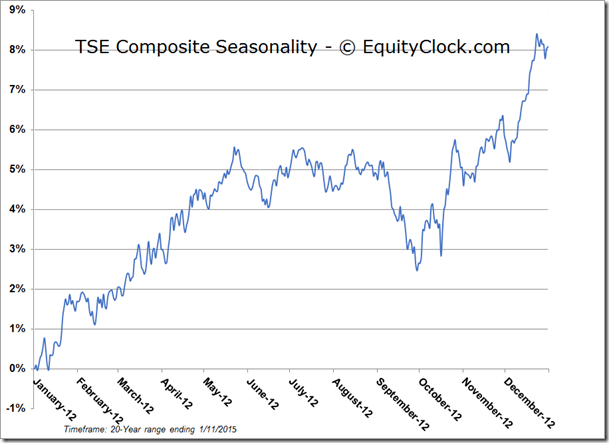
TSE Composite
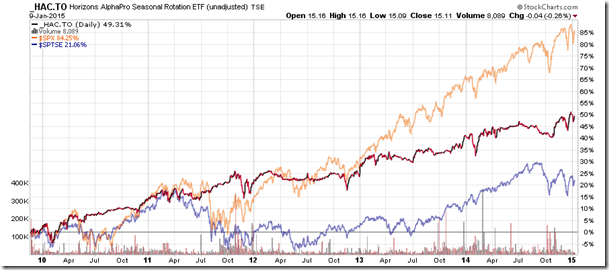
Horizons Seasonal Rotation ETF (TO:HAC)
- Closing Market Value: $15.11 (down 0.26%)
- Closing NAV/Unit: $15.09 (down 0.47%)
Performance
| 2015 Year-to-Date | Since Inception (Nov 19, 2009) | |
| HAC | -0.26% | 50.9% |
* performance calculated on Closing NAV/Unit as provided by custodian
Disclaimer: Stocks highlighted are for information purposes only and should not be considered as advice to purchase or to sell mentioned securities. As always, the use of technical and fundamental analysis is encouraged in order to fine tune entry and exit points to average seasonal trends.

