
**NEW** As part of the ongoing process to offer new and up-to-date information regarding seasonal and technical investing, we are adding a section to the daily reports that details the stocks that are entering their period of seasonal strength, based on average historical start dates. Stocks highlighted are for information purposes only and should not be considered as advice to purchase or to sell mentioned securities. As always, the use of technical and fundamental analysis is encouraged in order to fine tune entry and exit points to average seasonal trends.
Stocks Entering Period of Seasonal Strength Today:
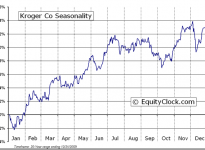
The Kroger Co. (NYSE:KR) Seasonal Chart
The Markets
Stocks closed firmly lower on Wednesday as energy shares once again dragged upon broad market benchmarks. The drawdown in energy share prices was “fueled” by another significant plunge in Oil prices as the latest inventory report indicated another increase of 1.5 million barrels. Analysts were expecting a decline of 2.7 million barrels. The current read puts oil inventories 52 million barrels above average for this time of year as increased production in the US floods the market with excess supply. Inventories typically decline in the month of December. The price of Crude Oil remains significantly oversold as it attempts to find a low that would correspond with seasonal norms for this time of year. Looking at the monthly chart, the commodity is testing support around the 200-month moving average, a level that has shown some significance in the past, providing support to the 2002 and 2009 lows. Horizontal support remains apparent around $58, below which the 2009 low around $35 would have to be watched. The intermediate trend of the energy commodity remains firmly negative, however, significantly oversold conditions increase the probability of a near-term bounce as negative bets are covered, particularly ahead of quadruple witching day a week from Friday and the Christmas holidays. Crude Oil enters a period of seasonal strength in February.

 Seasonal Chart")
Looking at the Bullish Percent Index of the Energy Sector, the breadth indicator has declined to levels that have typically corresponded with significant lows, at least on a short-term basis. When the technical indicator has fallen to levels below 15, tradable lows have typically followed, in some cases allowing for substantial short-term gains, as gauged by the Energy Sector ETF (ARCA:XLE). Isolating the instances over the past 14 years that the Bullish Percent Index for the sector has fallen below 5, the Energy Sector ETF (XLE) has averaged a gain of 5.24% in the week that followed and a gain of 10.02% in a 30-day period that followed. These bounces can be powerful as everyone that flooded into negative bets is forced to abruptly cover once the perceived direction changes. Seasonal tendencies for energy stocks start to turn positive in January, ahead of the period of seasonal strength for the commodity itself.

| Energy Sector Return following a reading of 5 or lower on the Bullish Percent Index | ||
| Dates | Return 7-days following | Return 30-days following |
| October 20, 2014 | 0.46% | 3.43% |
| October 5, 2011 | 5.97% | 17.75% |
| August 16, 2011 | -3.68% | -0.83% |
| March 3, 2009 | 6.60% | 18.45% |
| November 21, 2008 | 13.18% | 4.09% |
| October 10, 2008 | 5.86% | 14.85% |
| September 27, 2001 | 8.29% | 12.36% |
| Average: | 5.24% | 10.02% |
With energy shares taking a large hit, the Toronto market was once again impacted. The TSX Composite (TO:TLV) is now hovering around the October lows, although, a longer-term rising trendline that stems back to the 2009 low remains intact (a segment of that trendline is shown in the chart below). Still, declines below the October low down to around 12,900 remains a possibility, testing what was a previous level of resistance as new support. A break below 12,900 opens the probability that the highs charted in August and September were part of a double-top pattern, given the apparent level of long-term resistance just above 15,000. Downside pressures in this case could be significant. Seasonal tendencies for the Canadian market turn positive at the end of December as energy and material sectors strengthen into the new year.


Sentiment on Wednesday, as gauged by the put-call ratio, ended close to neutral at 0.96.

Seasonal charts of companies reporting earnings today:


TSE Composite


Horizons Seasonal Rotation ETF (TO:HAC)
- Closing Market Value: $14.65 (down 1.48%)
- Closing NAV/Unit: $14.66 (down 1.59%)
Performance*
| 2014 Year-to-Date | Since Inception (Nov 19, 2009) | |
| HAC.TO | 2.52% | 46.6% |
* performance calculated on Closing NAV/Unit as provided by custodian
