
**NEW** As part of the ongoing process to offer new and up-to-date information regarding seasonal and technical investing, we are adding a section to the daily reports that details the stocks that are entering their period of seasonal strength, based on average historical start dates.Stocks highlighted are for information purposes only and should not be considered as advice to purchase or to sell mentioned securities. As always, the use of technical and fundamental analysis is encouraged in order to fine tune entry and exit points to average seasonal trends.
Stocks Entering Period of Seasonal Strength Today:
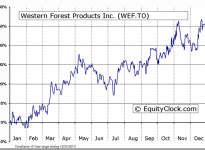
Western Forest Products, Inc. (TO:WEF) Seasonal Chart
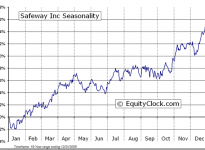
Safeway Inc. (NYSE:SWY) Seasonal Chart
The Markets
Stocks in the US finished mixed on Tuesday following a negative lead from markets overseas. Equity benchmarks in Europe fell by over 2% and stocks in China recorded sharp declines after the Chinese government set new restrictions on collateral for short-term collateralized loans. The Shanghai Stock Exchange Composite dropped 5.43%, the largest one day decline since 2009, instantly making progress in alleviating the extremely overbought condition that plagued the Chinese benchmark for the past few weeks. The Shanghai benchmark had gone parabolic in the past month, moving significantly above major moving averages, making it vulnerable to a snap pullback should a negative headline affect the tape. Support for the benchmark is implied around the 20 and 50-day moving averages at 2636 and 2478, respectively. The significant climb in recent weeks brought upon the conclusion to the negative direction that dominated the trend since peaking in 2007. A bottoming pattern carved out above support around 1950 instantly enticed investors to the index, leading to the rapid rise just ahead of the start of the period of seasonal strength. The benchmark seasonally gains from January through to April and May, outperforming US benchmarks in the process. A break above significant resistance around 3186 would draw in further investors through the period of strength, which has produced gains averaging around 10% over the past 20 years.


Although US benchmarks managed to mitigate much of the losses stemming from the negative sentiment overseas, the S&P 500 still recorded a break of support intraday at the 20-day moving average. This is the first time the benchmark has traded below this significant short-term moving average since late October; cracks are becoming apparent in the short-term trend of the market following the rapid rise from the October low. Horizontal support for the large-cap benchmark is suggested at 2019, the level from which the index broke above at the start of November; what was resistance now becomes support. Secondary support is apparent at 1991. Support at either of these levels would be sufficient to keep the potential for a newly formed intermediate positive trend intact, allowing for the anticipated Santa Claus rally that spans the last half of the month. Between now and the middle of December, tax loss selling continues to dominate. So far, this period of portfolio reallocation ahead of the end of the year has been quite orderly, despite a significant rise in volatility, as gauged by the Volatility Index (VIX). Should reasons to sell, such as negative headlines, fail to materialize, this period of short-term seasonal weakness may reveal a rather mild decline compared to historical averages. Weakness over this period typically allows for appealing buying opportunities for the significant period of strength around the Christmas and New Year’s holidays.

The rebound in the S&P 500 Index from the lows of the session was fuelled by support at the lower limit of the previously broken long-term trend channel, suggesting this previous pattern still has influence on trading activity. This lower trendline, now around 2035, stretches all the way back to mid-2013. Trend was broken for a matter of weeks in October, but a sharp rebound from the lows negated the significant breakdown and kept the longer-term trend of higher-highs and higher-lows alive. Looking at the monthly chart of the large-cap index, opening and closing values remain above a long-term trendline that stretches back to the 2009 low. Ongoing monthly closes above this key trendline would imply that the bull market remains intact and higher-highs should be expected.


Sentiment on Tuesday, as gauged by the put-call ratio, ended bearish at 1.05.

Seasonal charts of companies reporting earnings today:


S&P 500 Index


TSE Composite


Horizons Seasonal Rotation ETF (TO:HAC)
- Closing Market Value: $14.87 (up 0.07%)
- Closing NAV/Unit: $14.90 (down 0.07%)
Performance*
| 2014 Year-to-Date | Since Inception (Nov 19, 2009) | |
| HAC.TO | 4.20% | 49.0% |
* performance calculated on Closing NAV/Unit as provided by custodian
