Market Indexes:
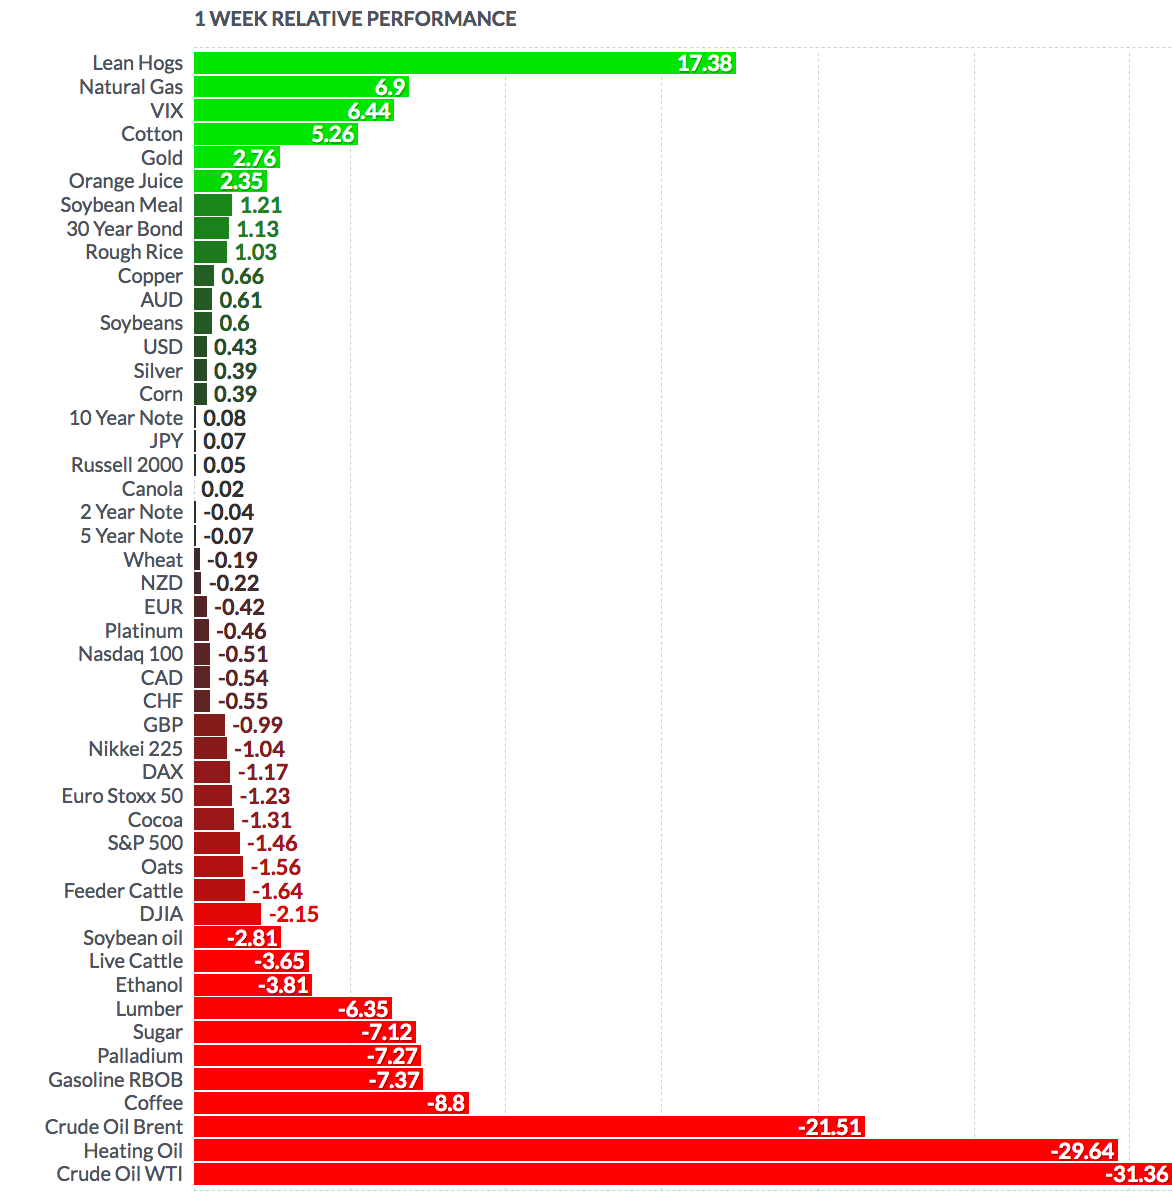
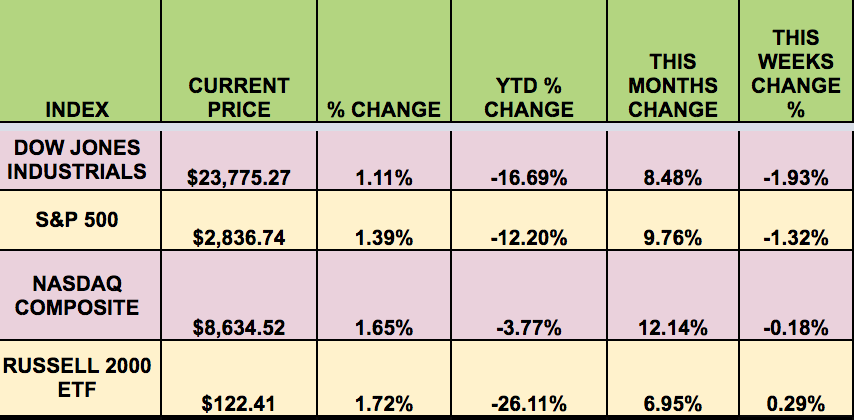
3 out of 4 indexes were down for the week, in spite of the new relief package approved by Congress. Oil went on a roller coaster ride this week, with oversupply pushing prices down temporarily to below zero.
The U.S. Senate on Tuesday approved $484 billion in a fresh relief package, which mainly expands funding for loans to small businesses.
“US oil prices were back in positive territory on Tuesday after a stunning collapse Monday, that saw levels crash below zero, trading at the lowest level since NYMEX opened futures trading in 1983.
US oil futures popped more than 100% — albeit to trade at just $1.65 a barrel. The May contract for West Texas International, which expires Tuesday, finished regular trading Monday at -$37.63 a barrel.
The June contract, which is now being traded more actively, rose 4.5% to $21.35 a barrel during Asian trading hours, still a troublesomely low number. The coronavirus pandemic has caused oil demand to drop so rapidly that the world is running out of room to store barrels. At the same time, Russia and Saudi Arabia flooded the world with excess supply. Analysts also attributed Monday’s plunge to frantic last minute trading because of the quickly expiring May contract.” (CNN)
Volatility:
The VIX rose 4% this week, ending at $35.93, vs. $34.55 last week.
High Dividend Stocks:
These high yield stocks go ex-dividend next week: PPX, AEO, AGNC, EFC, EPD, OHI, PSEC, BMO, KNOP.
Market Breadth:
9 out of 30 DOW stocks rose this week, vs. 20 last week. 33% of the S&P 500 rose, vs. 54% last week.
FOREX:
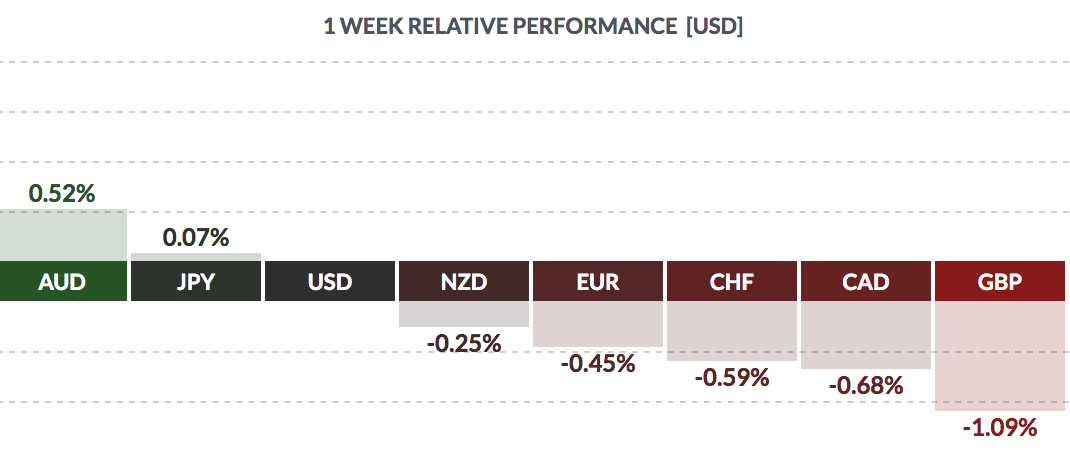
The USD gained vs. most major currencies this week, except he Aussie and the yen.
Economic News:
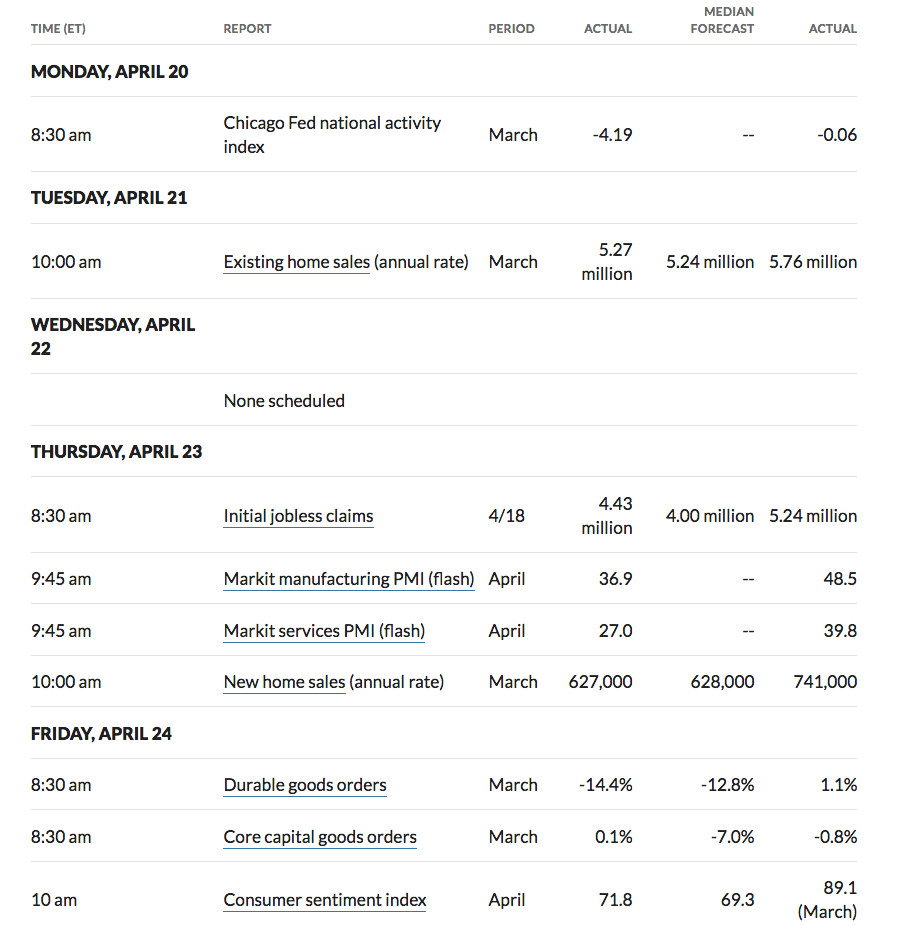
“Sales of new U.S. single-family homes dropped by the most in more than 6-1/2 years in March and further declines are likely as the novel coronavirus outbreak batters the economy and throws millions of Americans out of work. New home sales fell 15.4% to a seasonally adjusted annual rate of 627,000 units last month. The percentage decline was the largest since July 2013. February’s sales pace was revised down to 741,000 units from the previously reported 765,000 units. Sales declined 9.5% from a year ago in March.” (REUTERS)
“Initial claims for state unemployment benefits dropped 810,000 to a seasonally adjusted 4.427 million for the week ended April 18. Data for the prior week was revised to show 8,000 fewer applications received than previously reported, reducing the count for that period to 5.237 million. All told, 26.453 million people have filed claims for jobless benefits since March 21, representing 16.2% of the labor force. The economy created 22 million jobs during the employment boom which started in September 2010 and abruptly ended in February this year. Though weekly jobless filings remain very high, last week’s data marked the third straight weekly decline, raising hopes that the worst may be over. Weekly claims appeared to have peaked at a record 6.867 million in the week ended March 28. ” (Reuters)
“The U.S. economy faces a bleak immediate future with gross domestic product likely contracting 12% in the second quarter and the federal deficit growing to $3.7 trillion, while the unemployment rate will probably crest at 16% in the third quarter, according to projections released by the Congressional Budget Office on Friday.” (Reuters)
Week Ahead Highlights:
“With claims expected to gradually decline in the coming weeks as more small enterprises access funding, attention will shift to the number of people on unemployment benefits rolls.
The so-called continuing claims data is reported with a one-week lag and is considered a better gauge of unemployment. Continuing claims jumped 4.064 million to a record 15.976 million in the week ending April 11. Next week’s continuing claims data will offer some clues on the magnitude of the anticipated surge in the unemployment rate in April. Continuing claims have not increased at the same pace as initial jobless applications.” (Reuters)
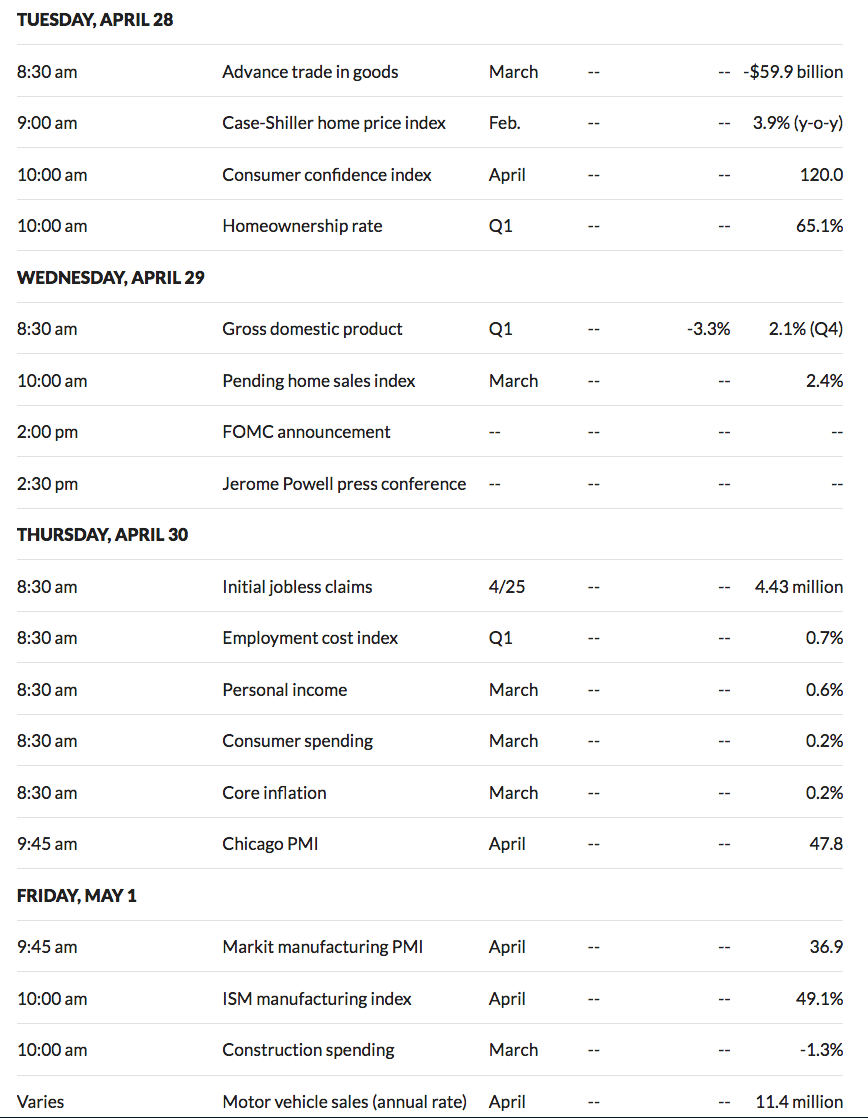
The Fed is slated to make its FOMC announcement on Wednesday. We’ll get an estimate for Q1 2020 GDP – it’s expected to drop by -3.3%.
Next Week’s US Economic Reports:
Sectors:
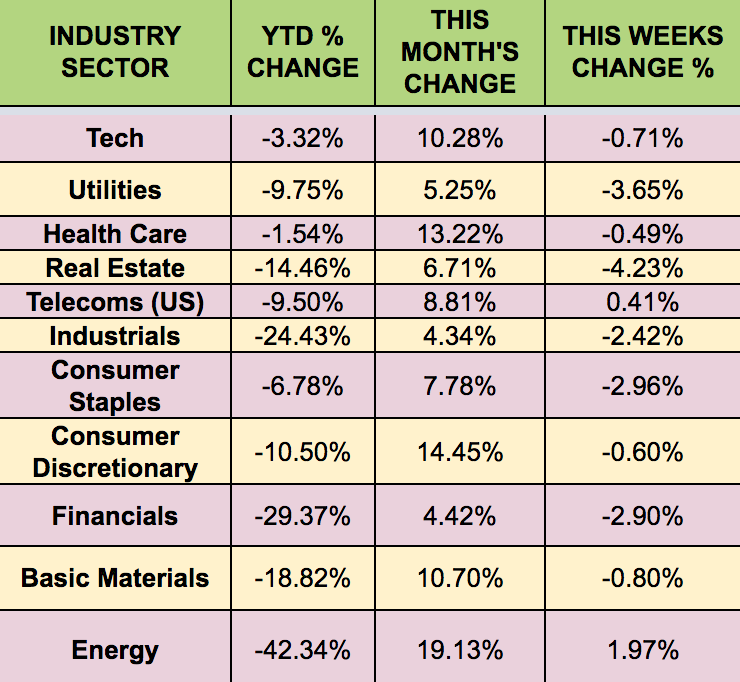
Energy and Telecoms led this week, with Real Estate and Utilities lagging.
Futures:
WTI Crude crude fell 31% this week, after going negative on Monday, but ended up 4% higher on Friday, ending at $17.18.
“Oil jumped more than 30% on Thursday, accelerating the recent rally as the Street eyed continued production cuts and rising U.S.-Iranian tensions. WTI crude rose 30%, or $4.18, to trade at $17.96 per barrel, after rising 19% on Wednesday.” (CNBC)
