The Stock Exchange is all about trading. Each week we do the following:
- Discuss an important issue for traders;
- Highlight several technical trading methods, including current ideas;
- Feature advice from top traders and writers; and,
- Provide a few (minority) reactions from fundamental analysts.
We also have some fun. We welcome comments, links, and ideas to help us improve this resource for traders. If you have some ideas, please join in!
Review:
Our previous Stock Exchange explained some of the important differences between investing and trading. We used Bitcoin as a specific example. If you missed it, a glance at your news feed will show that the key points remain relevant.
This Week: Pullback Fear? Consider Uncorrelated Stocks
Just as a broken clock is right twice a day, pundits warn relentlessly of the next big stock market pullback… until one finally arrives. And considering our almost uninterrupted rally since the depths of the financial crisis more than eight years ago, it’s understandable that some stock market participants are nervous.
Historically, investors have been able to take some risk off the table by investing in bonds. And since the early 1980’s, investors have enjoyed the benefits of sinking interest rates (i.e. when interest rates go down, bond prices go up). But now the tables are turned, interest rates are low and they’re rising—this is a decidedly less attractive situation.
Investment strategies that are less correlated with the overall market (and still offer attractive returns) are compelling because they can significantly reduce risk while simultaneously making money.One of the benefits of our trading strategies is their low correlation with the overall stock market (more on this later).
Something New—More Data
This week we’re implementing something new for our readers. We’re including a table summarizing the results for our models, which work well when combined. The tables show the actual client results after commissions and fees (I watch this every day, and now readers can see it as well). We’ll share additional information, including test data, with those interested in investing. For our weekly updates, we use only real-time results.
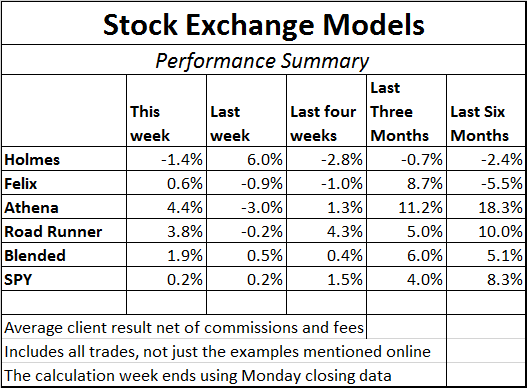
The results in the table above include all of the positions (10 for Road Runner and Athena, 16 for Holmes, and 20 for Felix), not just the specific stock examples we discuss in the Stock Exchange every week (and sorry Oscar, you have too many individual stocks and trades to be part of this approach). We’ve included six months of data since that is the shortest real-time record we have. All of the models are expected to perform well over longer time periods. Holmes, for example, has returned over 22% in the last eighteen months.
Very importantly, the following correlation matrix shows the attractively low correlation of our strategies versus the market, as measured by the S&P 500 (SPDR S&P 500 (NYSE:SPY)).

Unlike most equity strategies, our approach has a very low correlation to the market. This is an attractive quality because it can reduce risk (as measured by volatility) while simultaneously keeping returns high. So if you are fearing a market pullback, our lower correlation strategies can be attractive and worth considering.
Expert Picks from the Models:
This week’s Stock Exchange is being edited by Blue Harbinger (aka Mark Hines). Blue Harbinger is a source for independent investment ideas.
RoadRunner: This week I like Applied Materials (NASDAQ:AMAT). I like to buy stocks that are at the bottom of a rising channel, and if you look at the chart below you can see why I like Applied Materials.
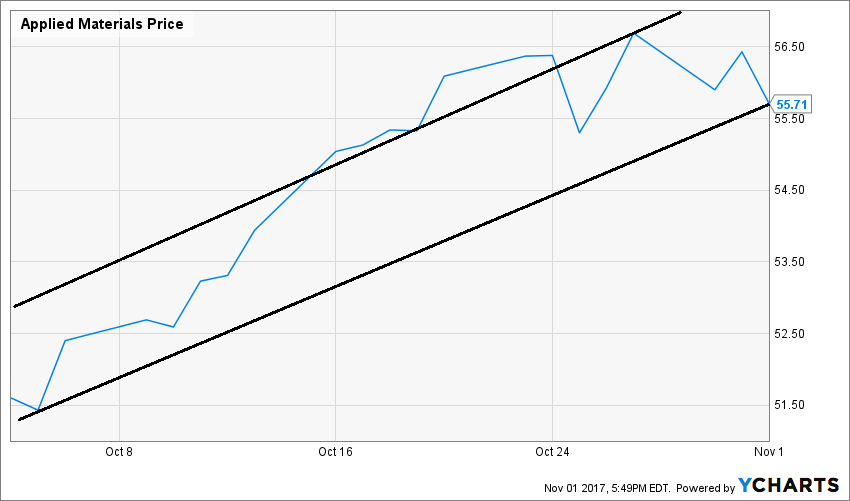
Blue Harbinger: Interesting pick Road Runner. Applied Materials’ price has been increasing significantly since the start of 2016. And considering your momentum-driven strategy, I can see why you think it may be going higher. From a fundamentals standpoint, the company supplies manufacturing equipment to the semiconductor industry, and this is an industry with tremendous long-term growth potential. Not only the continued proliferation and complexity of smart phones, but also artificial intelligence and the Internet of Things (“IoT”) will help this entire industry grow for many years to come.
RR: That’s nice, Blue Harbinger, that you’re looking “many years” into the future, but my typical holding period is only about 4-week. I’ll be in an out long before “5g” networks ever arrive.
BH: 4-weeks Road Runner? Really? And what will you do if the market turns south, like so many pundits and prognosticators are warning?
RR: First of all, I don’t let emotions like fear and greed impact my decisions. I am a data-driven model. I’m totally objective. And second of all, when my strategy is combined with the our other models (some of which are NOT momentum-driven) we do quite well, as the early table in this report shows.
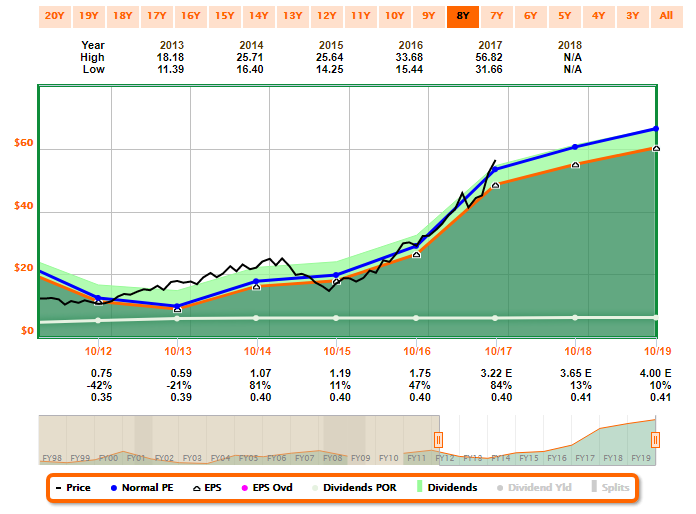
BH: I’m impressed with your results so far, but more data is always nice. And if you change your mind, here is a look at some helpful fundamental data in the following Fast Graph from Chuck Carnevale—it’s good stuff.
RR: Thanks. How about you Holmes? What have you got this week?
Holmes: In a rare twist, I don’t have any new picks for you this week. I’m usually able to find something attractive, but I don’t force things when the opportunity is just not there.
BH: Wow—that is a rare twist. You’ve usually got something. How about you, Athena? Do you have anything for us this week?
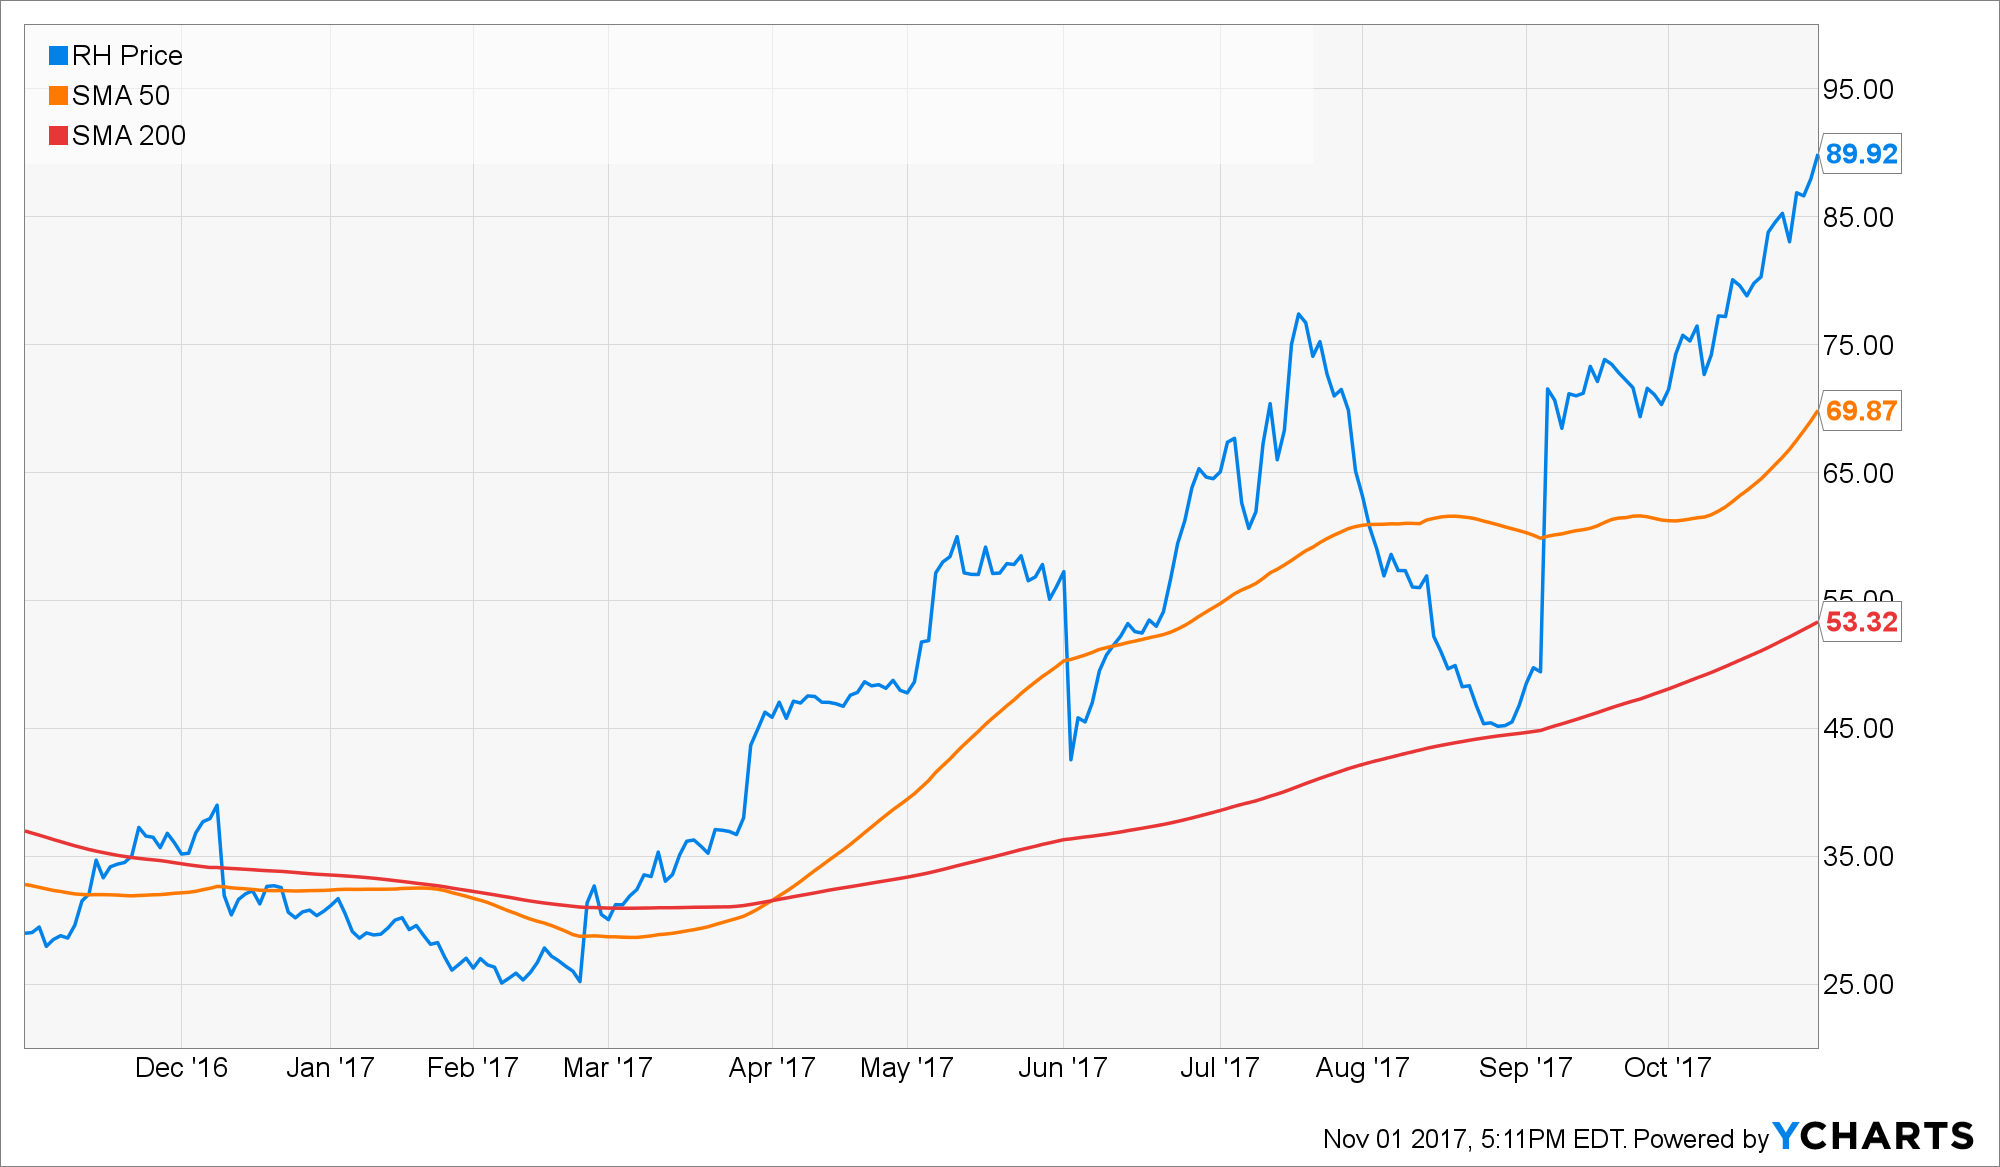
Athena: This week I like RH (NYSE:RH) (formerly Restoration Hardware). I utilize a momentum strategy, my average holding period is 1-month, I use stops to control risks, and I exit when my price target is achieved. You can see RH’s recent performance in the following chart. It’s above its 50-day and 200-day simple moving averages, and it’s got room to run.
BH: Interesting pick, Athena. If you recall, Road Runner basically hit a home run with RH when he picked it during the week of August 25th (he typically holds for 4-weeks). And you also picked this one back in mid-July. How did that work out for you?
Athena: Last time I picked RH it worked out just fine. My recent track record is included in the table earlier in this report, and my 3-month record (i.e. since my last RH pick) is very strong.
BH: The CEO of this company keeps buying more shares. He recently owned over 2.2 million of the company’s 21 million shares outstanding. Insider buying can be a good sign. Fundamentally, this company’s profit margin has been thin, but revenues remain strong. Here is a look at the Fast Graph.
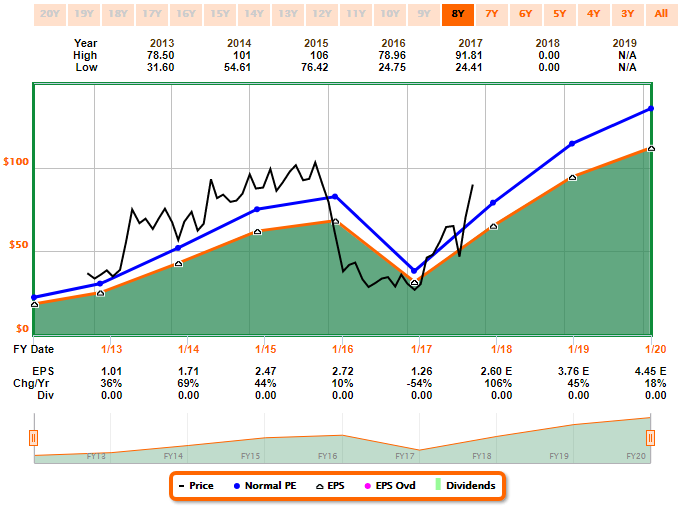
Athena: Thanks for that information. I usually hold for about 1-month, so check back with me then. How about you Felix, what have you got for us this week?
Felix: This week I ran the most liquid stocks in the Russell 2000 small cap index through my model, and I have included the top 20 in the table below.
BH: I see RH made your list. I suppose that makes some sense considering you and Athena are both momentum traders.
Felix: True. I am a momentum trader. But I tend hold things longer than the other traders, 66 weeks on average. I exit when my price target is reached, and I control risk by monitoring macro factors and using stops.
BH: RH has been an interesting one to follow considering the volatile price and the signifcant share buybacks. Thanks for sharing all 20 of those stocks. I see some names on there I recognize, and a few that I will look into. Anyway, how about you, Oscar? Have you got anything for us this week.
Oscar: This week I have provided a ranking of the high volume ETFs. They’re included in the following table.
BH: That is interesting. I recognize almost all of the ETFs on your list (except for Direxion Daily Small Cap Bear 3X Shares (NYSE:TZA)—I had to look that one up. It’s the Drexion Small Cap 3X Bear ETF). Considering you follow a momentum strategy, I can see why some of those ETFs make sense on your list, but some seem like an anomoly to me.
Oscar: You are correct, I am a momentum trader, but my average holding period is typically about 6-weeks. I rotate into another sector when it’s time to exit, and I also use stops to conrol risk.
BH: Thanks for sharing your list Oscar. I always enjoy hearing about what is interesting to you.
Conclusion:
Investment strategies that are uncorrelated with the market are attractive because of the diversification benefits they can offer. Specifically, uncorrelated return streams can keep total returns high, and portfolio risks (volatility) low. Our models have been designed to identify attractive securities, and our model strategies have low correlations to the overall stock market, as measured by the S&P 500. Combining our momentum and mean reversion strategies allows us to build attractive investment portfolios with less volatility. And if you’re afraid of a market pullback as described in the title of this article, strategies uncorrelated with the market can be quite compelling.
Background on the Stock Exchange:
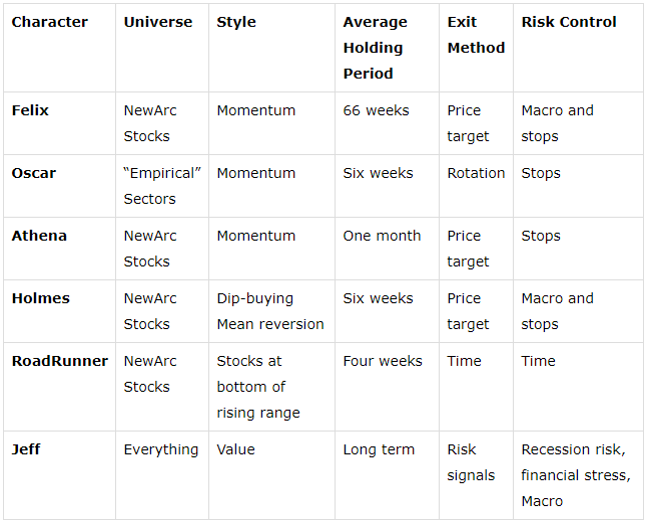
Each week, Felix and Oscar host a poker game for some of their friends. Since they are all traders, they love to discuss their best current ideas before the game starts. They like to call this their “Stock Exchange.” (Check it out for more background). Their methods are excellent, as you know if you have been following the series. Since the time frames and risk profiles differ, so do the stock ideas. You get to be a fly on the wall from my report. I am usually the only human present and the only one using any fundamental analysis.
The result? Several expert ideas each week from traders, and a brief comment on the fundamentals from the human investor. The models are named to make it easy to remember their trading personalities.
Getting Updates:
Readers are welcome to suggest individual stocks and/or ETFs to be added to our model lists. We keep a running list of all securities our readers recommend, and we share the results within this weekly “Stock Exchange” series when feasible. Send your ideas to “etf at newarc dot com”. Also, we will share additional information about the models, including test data, with those interested in investing. Suggestions and comments about this weekly “Stock Exchange” report are welcome.


