The Stock Exchange is all about trading. Each week we do the following:
- Discuss an important issue for traders;
- highlight several technical trading methods, including current ideas;
- feature advice from top traders and writers; and,
- provide a few (minority) reactions from fundamental analysts.
We also have some fun. We welcome comments, links, and ideas to help us improve this resource for traders. If you have some ideas, please join in!
Review:
Our previous Stock Exchange suggested to readers that they trade with more perspective, by adding new tools and techniques through which to view their trades. If you missed it, a glance at your news feed will show that the key points remain relevant.
This Week: Is This Trend Really Your Friend?
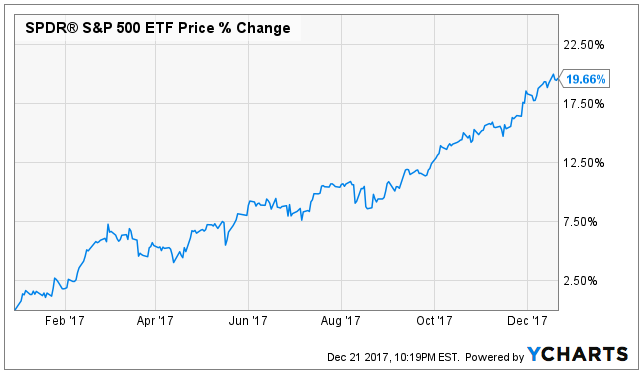
It’s no secret the stock market is doing very well this year. The S&P 500 (via SPDR S&P 500 (NYSE:SPY)) is up 10% in the last six months and 20% year-to-date.
Not surprisingly, momentum and trend-following strategies are also doing very well. For example, our two momentum-based trading strategies (Felix and Athena) are up 28.5% and 22.9% in just the last six months (see our performance table below). But as Charlie Bilello of Pension Partners reminds us in a recent article titled, Stop Searching for the Holy Grail:
“a) the very best performing strategies all have many periods of bad and b) you cannot predict when the good/bad periods are going to occur.”
It’s basically for the reason Charlie describes that we use a blended approach between momentum and dip-buying in our trading models, and you can see our results in the following table (note: this table shows actual client results after commissions and fees).
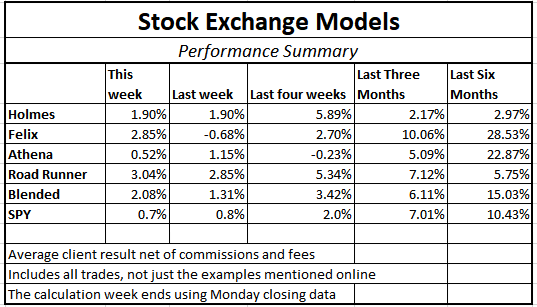
We find that blending a trend-following / momentum model (Athena) with a mean reversion / dip-buying model (Holmes) provides two strategies, effective in their own right, that are not correlated with each other or with the overall market. By combining the two, we can get more diversity, lower risk, and a smoother string of returns.
When Companies Change Strategic Direction:
And just as trading strategies (e.g. momentum, trend-following) can work great until all-of-a-sudden they don’t, so too can corporate strategies have a great outlook until all-of-a sudden things take a dramatic turn. This week’s “expert picks from the models” focus trading the stocks of companies that are experiencing a dramatic change in strategic direction.
Expert Picks From The Models:
This week’s Stock Exchange is being edited by Blue Harbinger (Blue Harbinger is a source for independent investment ideas).
Road Runner: This week I like Valeant Pharmaceuticals International Inc (NYSE:VRX). I am sure you are familiar with this stock, correct Blue Harbinger?
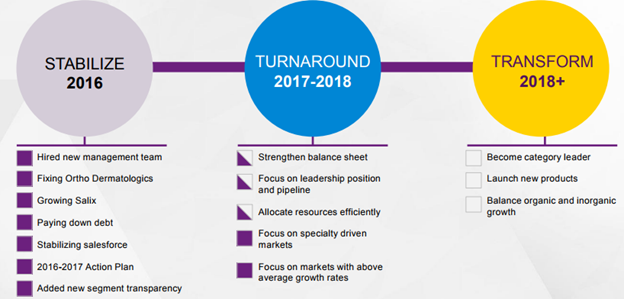
Blue Harbinger: Yes, it’s a pharmaceuticals company. Valeant is trying to focus on eye health, gastroenterology and dermatology. The stock price has fallen from over $250 per share in 2015 to about $21 per share now. Short interest was recently very high, and the company is trying to work its way through a very heavy debt load. Valeant is working hard to change its strategic direction as shown in the following graphic.
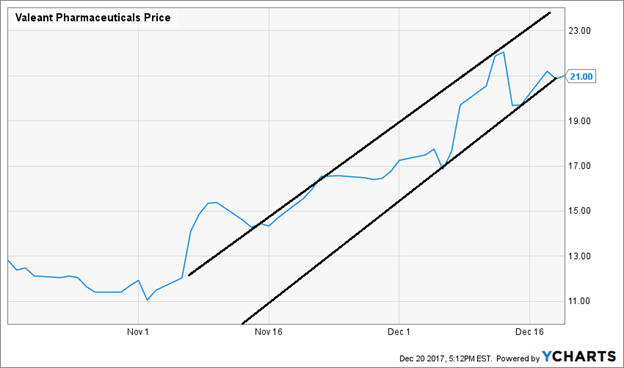
RR: That is all interesting, but as you know, I like to buy stocks that are at the bottom of a rising channel. And based on the following chart, you can see why I like Valeant right now.
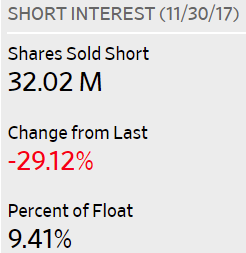
BH: That’s an interesting chart, Road Runner, but have you considered that the “up-channel” you’ve highlighted may be due to a short squeeze? For example, here is a look at the dramatic decline in short-interest, per the Wall Street Journal:
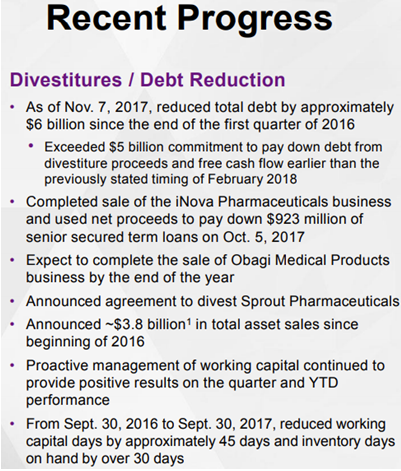
Valeant announced earnings back on November 7th, and they beat revenue expectations, and they’ve been making good progress on getting debt under control. Here is a look at some of the progress they’ve been making on their debt.
RR: My typical holding period is about 4-weeks. So I’ll be in and out of this trade before the long-term fundamental story plays out.
BH: Well—you have a decent track-record over the last six-months. But honestly, my time frame is more long-term, and if I had to pick, I actually like some of Valeant’s bonds more than its stock.
RR: Interesting. Thanks Blue Harbinger. How about you Felix—what do you like this week?
Felix: This week I like Huntsman Corporation (NYSE:HUN). Are you familiar with this company?
BH: Yes, Huntsman makes specialty chemicals and plastics that go into things like Boeing (NYSE:BA) airplanes, BMW (DE:BMWG) cars and Nike (NYSE:NKE) shoes. This is also another company that has recently experienced some big changes to its strategic direction. For example, it recently reduced its employee headcount from 15,000 to around 10,000 when it spun off its pigments and additives subsidiary into a separate publicly traded company, Venator (VNTR). It also had big plans to merge with Clariant, but that was very recently called off after an activist investor, White Tale Holdings, acquired a lot of shares, and voted against the merger claiming the Clariant-Huntsman transaction lacked strategic rationale and undercut Clariant’s strategy of becoming a pure-play specialty chemicals company. Huntsman was very disappointed the deal couldn’t be completed.
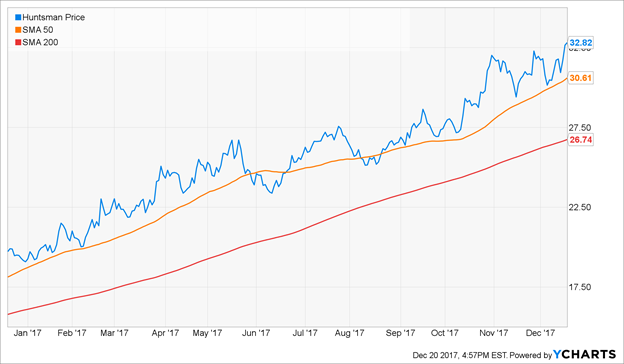
Felix: That is interesting background, but as you know, I am a momentum trader. Huntsman trades above its 200-day and 50-day moving averages, and based on the following chart, you can see why I like it
BH: How long do you typically hold your trades, Felix?
Felix: I typically hold my positions for about 66 weeks—which is much longer than the other models. I exit when my price target is hit, and I use stops and macro considerations to control risks.
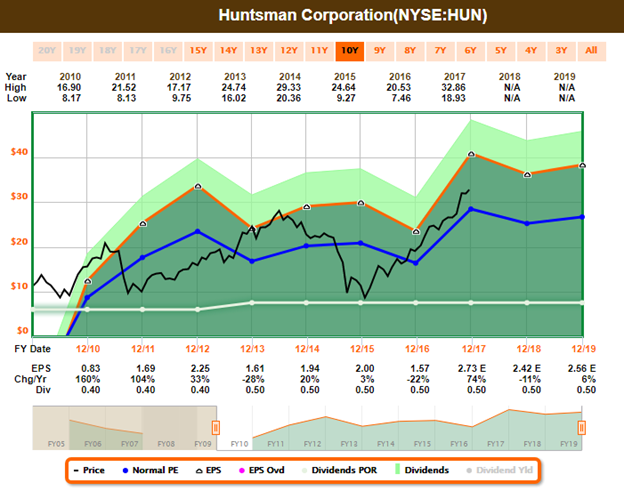
BH: Huntsman is an interesting story. As long as the economy keeps booming, Huntsman will likely continue to do very well. As you probably know, Huntsman is a high beta stock, even after spinning off Venator, which was a more cyclical business.
Felix: I also ran the entire list of NASDAQ 100 stocks through my model, and you can see the top 20 rankings in the following list.

BH: Thanks for that list, Felix. I see a lot of the usual suspects (i.e. stocks that have been performing well this year) which makes sense considering you’re a momentum trader. How about you Oscar, what have you got this week?
Oscar: This week I’m sharing my top ranked ETFs from my universe of high-volume ETFs. The following list includes my top 20.

BH: Thanks Oscar. That is a very diverse group of ETFs on your list. I recall from our previous conversations that you are a momentum trader, you hold for about 6-weeks, and you control risks with stock and by rotating into a new sector. Thank you for sharing this information.
Conclusion:
Strategies, whether they be trading or corporate, work until they don’t. As long as market conditions stay in your favor, so too will your strategy likely be able to deliver profits. But when the market changes direction, your old strategies may be challenged. Rather than simply sticking to what’s been working best lately (i.e. trend following), we use a blended approach (i.e. trend-following plus mean-reversion). By combining the two, we can get more diversity, lower risk, and a smoother string of returns.
Background On The Stock Exchange:
Each week, Felix and Oscar host a poker game for some of their friends. Since they are all traders, they love to discuss their best current ideas before the game starts. They like to call this their “Stock Exchange.” (Check out Background on the Stock Exchange for more background). Their methods are excellent, as you know if you have been following the series. Since the time frames and risk profiles differ, so do the stock ideas. You get to be a fly on the wall from my report. I am usually the only human present and the only one using any fundamental analysis.
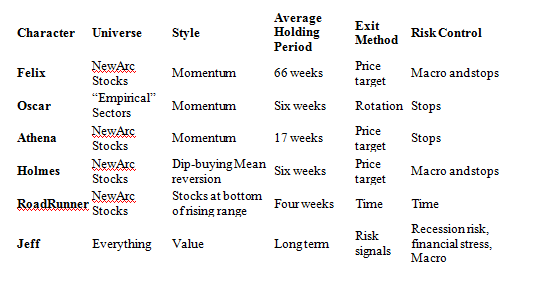
The result? Several expert ideas each week from traders, and a brief comment on the fundamentals from the human investor. The models are named to make it easy to remember their trading personalities.
Stock Exchange Character Guide:
Getting Updates:
Readers are welcome to suggest individual stocks and/or ETFs to be added to our model lists. We keep a running list of all securities our readers recommend, and we share the results within this weekly “Stock Exchange” series when feasible. Send your ideas to “etf at newarc dot com.” Also, we will share additional information about the models, including test data, with those interested in investing. Suggestions and comments about this weekly “Stock Exchange” report are welcome.
