The Stock Exchange is all about trading. Each week we do the following:
- Discuss an important issue for traders;
- highlight several technical trading methods, including current ideas;
- feature advice from top traders and writers; and,
- provide a few (minority) reactions from fundamental analysts.
We also have some fun. We welcome comments, links, and ideas to help us improve this resource for traders. If you have some ideas, please join in!
Review:
Our previous Stock Exchange considered the benefits of trading strategies that have a low correlation with the overall market (i.e. such strategies can be attractive, especially for investors fearing a market-wide pullback—or simply uncomfortable with volatility). If you missed it, a glance at your news feed will show that the key points remain relevant.
This Week: Fearing Macro Headwinds? Try A Blended Approach
This week’s Stock Exchange continues the discussion of the benefits of low-correlation trading strategies. For example, the traditional wisdom for reducing risk has been to invest in less stocks and more bonds. However, with interest rates still near historically low levels (and expected to keep rising, thereby putting downward pressure on bond prices) bonds are decidedly less attractive for many investors. And with the threat of inflation on the horizon, bonds can be even less appealing considering their low real returns. Further complicating the macroeconomic environment, the president’s new pick for fed chairmen is expected to not rock the boat significantly, but he does add some uncertainty.
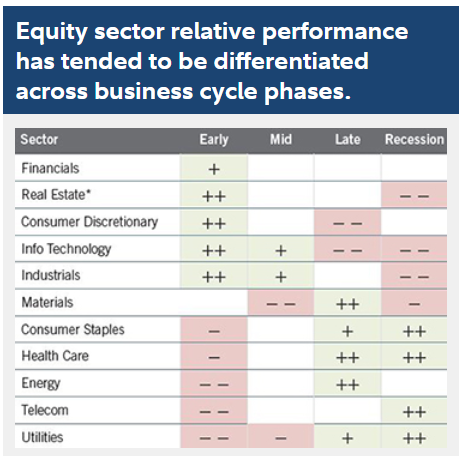
Other macroeconomic headwinds include dynamic international trade policies which could have long-term impacts on the strength (or weakness) of the US dollar, proposed changes to US tax rules, and simply the fact the markets continue to set new highs thereby making many investors increasingly nervous that this rally cannot continue forever. For perspective, the following chart shows which market sectors typically perform best during different stages of the market cycle, and the recent strength we’ve experienced in technology stocks, for example, is consistent with the idea that the current market rally will eventually capitulate.
Trading Model Performance:
In managing our trading models, we find that low correlattion trading strategies can keep returns high while simultaneously reducing the volatility risks associated with many of the macroeconomic headwinds that keep traditional stock market investors up at night. And per reader feedback, we’ve recently started including a table summarizing the performance results for our models. The table (below) shows actual client results after commissions and fees (I watch this every day, and now readers can see it as well). We’ll share additional information, including test data, with those interested in investing. For our weekly updates, we use only real-time results.
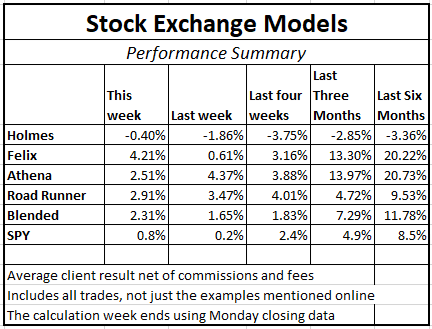
The results in the table above include all of the positions (10 for Road Runner and Athena, 16 for Holmes, and 20 for Felix), not just the specific stock examples we discuss in the Stock Exchange every week (and sorry Oscar, you have too many individual stocks and trades to be part of this approach). We’ve included six months of data since that is the shortest real-time record we have. All of the models are expected to perform well over longer time periods. Holmes, for example, has returned over 21% in the last eighteen months.
Unlike most equity strategies, our approach has a very low correlation to the market. This is an attractive quality because it can reduce risk (as measured by volatility) while simultaneously keeping returns high. If you are uncomfortable with macroeconomic volatility, our lower correlation strategies can be attractive and worth considering.
Expert Picks From The Models:
This week’s Stock Exchange is being edited by Blue Harbinger (aka Mark Hines). Blue Harbinger is a source for independent investment ideas.
Holmes: This week I bought Itau Unibanco Holding (ITUB). Are you familiar with this company?
Blue Harbinger: Yes, Holmes. This is the largest privately owned bank in Brazil. And I’m very curious, what has gotten you interested in this stock?
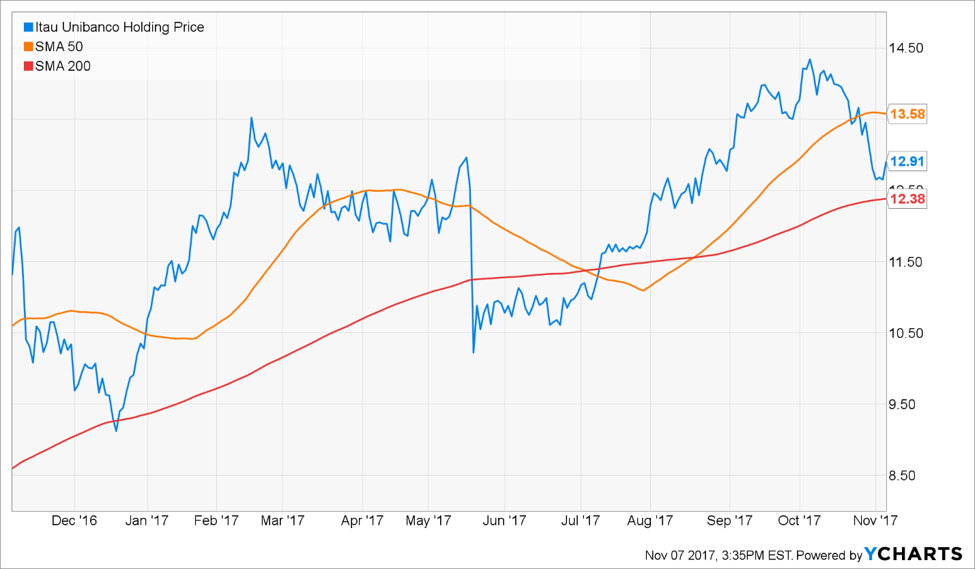
Holmes: It ranks highly in my model. I am able to sift through data on many different securities (including ADRs, like ITUB). And ITUB’s dip over the last month is the sort of set up I like to see. From the chart below you can see it is below its 50-day moving average, and it has attractive upside over the next six weeks.
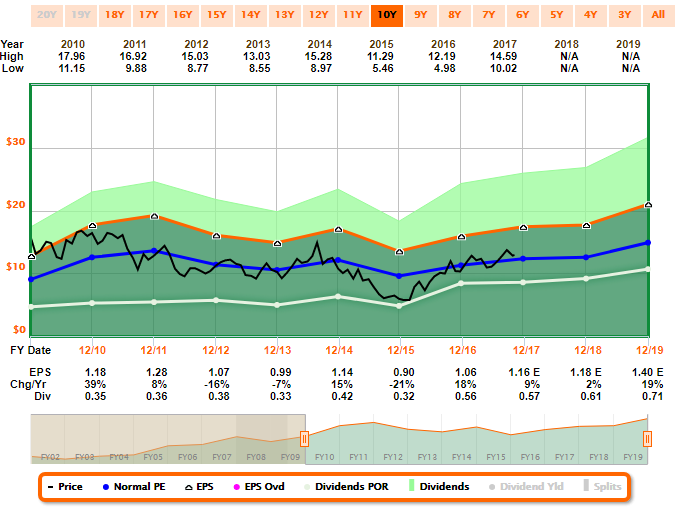
BH: Holmes, this stock scares me. It seems the Brazilian economy has a lot of political and inflation risks right now. For example, Brazil has a large budget deficit (including huge pension liabilities) and I’m afraid the government may basically try to print money in order to meet its obligations (like they’ve basically done in the past). This would spell bad news for banking stocks like ITUB. For further perspective, here is a look at this company’s FastGraph.
Holmes: I am a trader, and my typical holding period is about 6-weeks, so I’ll be in and out of this one before the long-term inflation risks set it. I am attracted by the current price (i.e. it has upside).
BH: So you’re not concerned with the macroeconomic risks facing this stock?
Holmes: I’m a trading model, and my security selection and holding period is far less correlated with the overall market than a buy-and-hold strategy. Besides, when you combine my trades with the other trading models, we deliver strong returns that have low correlation with the market. If you’re concerned with macro headwinds, my trades should be attractive to you
BH: I’ll keep a close eye on ITUB, and let’s discuss in about 6-weeks (i.e. after your typical holdings period).
Holmes: Deal. How about you Road Runner, do you have any trades for us?
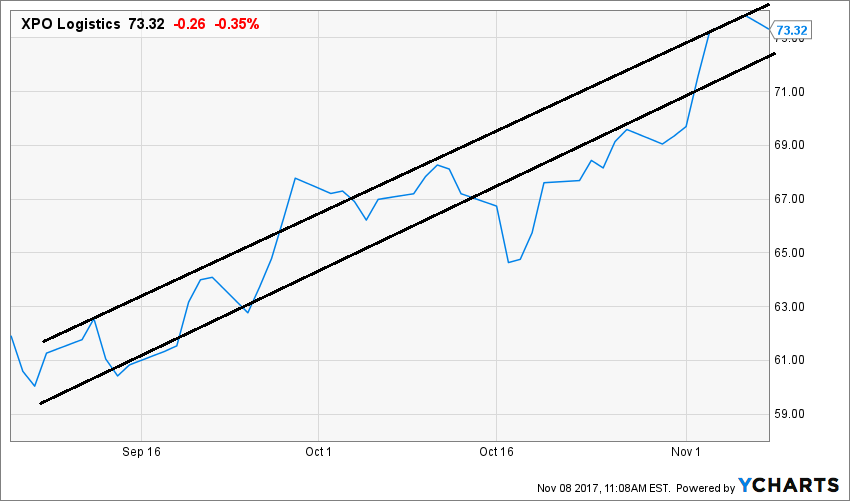
Road Runner: I don’t have any new buys this week, but I sold XPO logistics (XPO) last week. If you recall, I bought that one back on September 7th, and the trade worked out quite well for me, as you can see in the following chart.
BH: Remind us Road Runner, what exactly is your style?
RR: I like to buy stocks that are at the bottom of a rising channel.
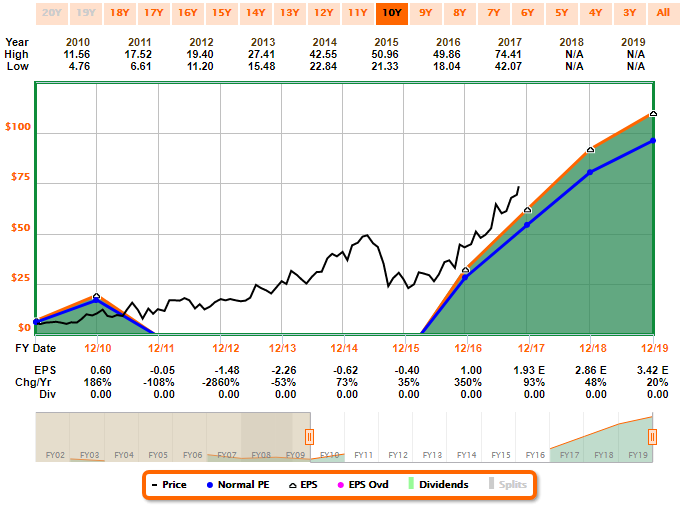
BH: Sounds like a combination of mostly momentum and little “dip buying.” Momentum trades have been working great in our current macro environment (the market has been rallying), and I appreciate buying things on the dip. XPO has been exhibiting strong fundamentals too (as you can see in the following FastGraph), but the industrial sector as a whole has been doing well considering where we are in the market cycle as shown in our earlier sector table.
RR: If you’re worried about a market pullback, consider a blended approach. As the earlier performance table shows, a blended approach between our trading models has been performing quite well.
BH: Thanks Road Runner. How about you Athena, do you have any trades for us?
Athena: I sold my Tesla (NASDAQ:TSLA) shares last week.
BH: Any particular reason?
Athena: the trade simply wasn’t working out as well as expected, so I exited the position for risk management purposes. I originally bought the shares on July 20th as we discussed in this article.
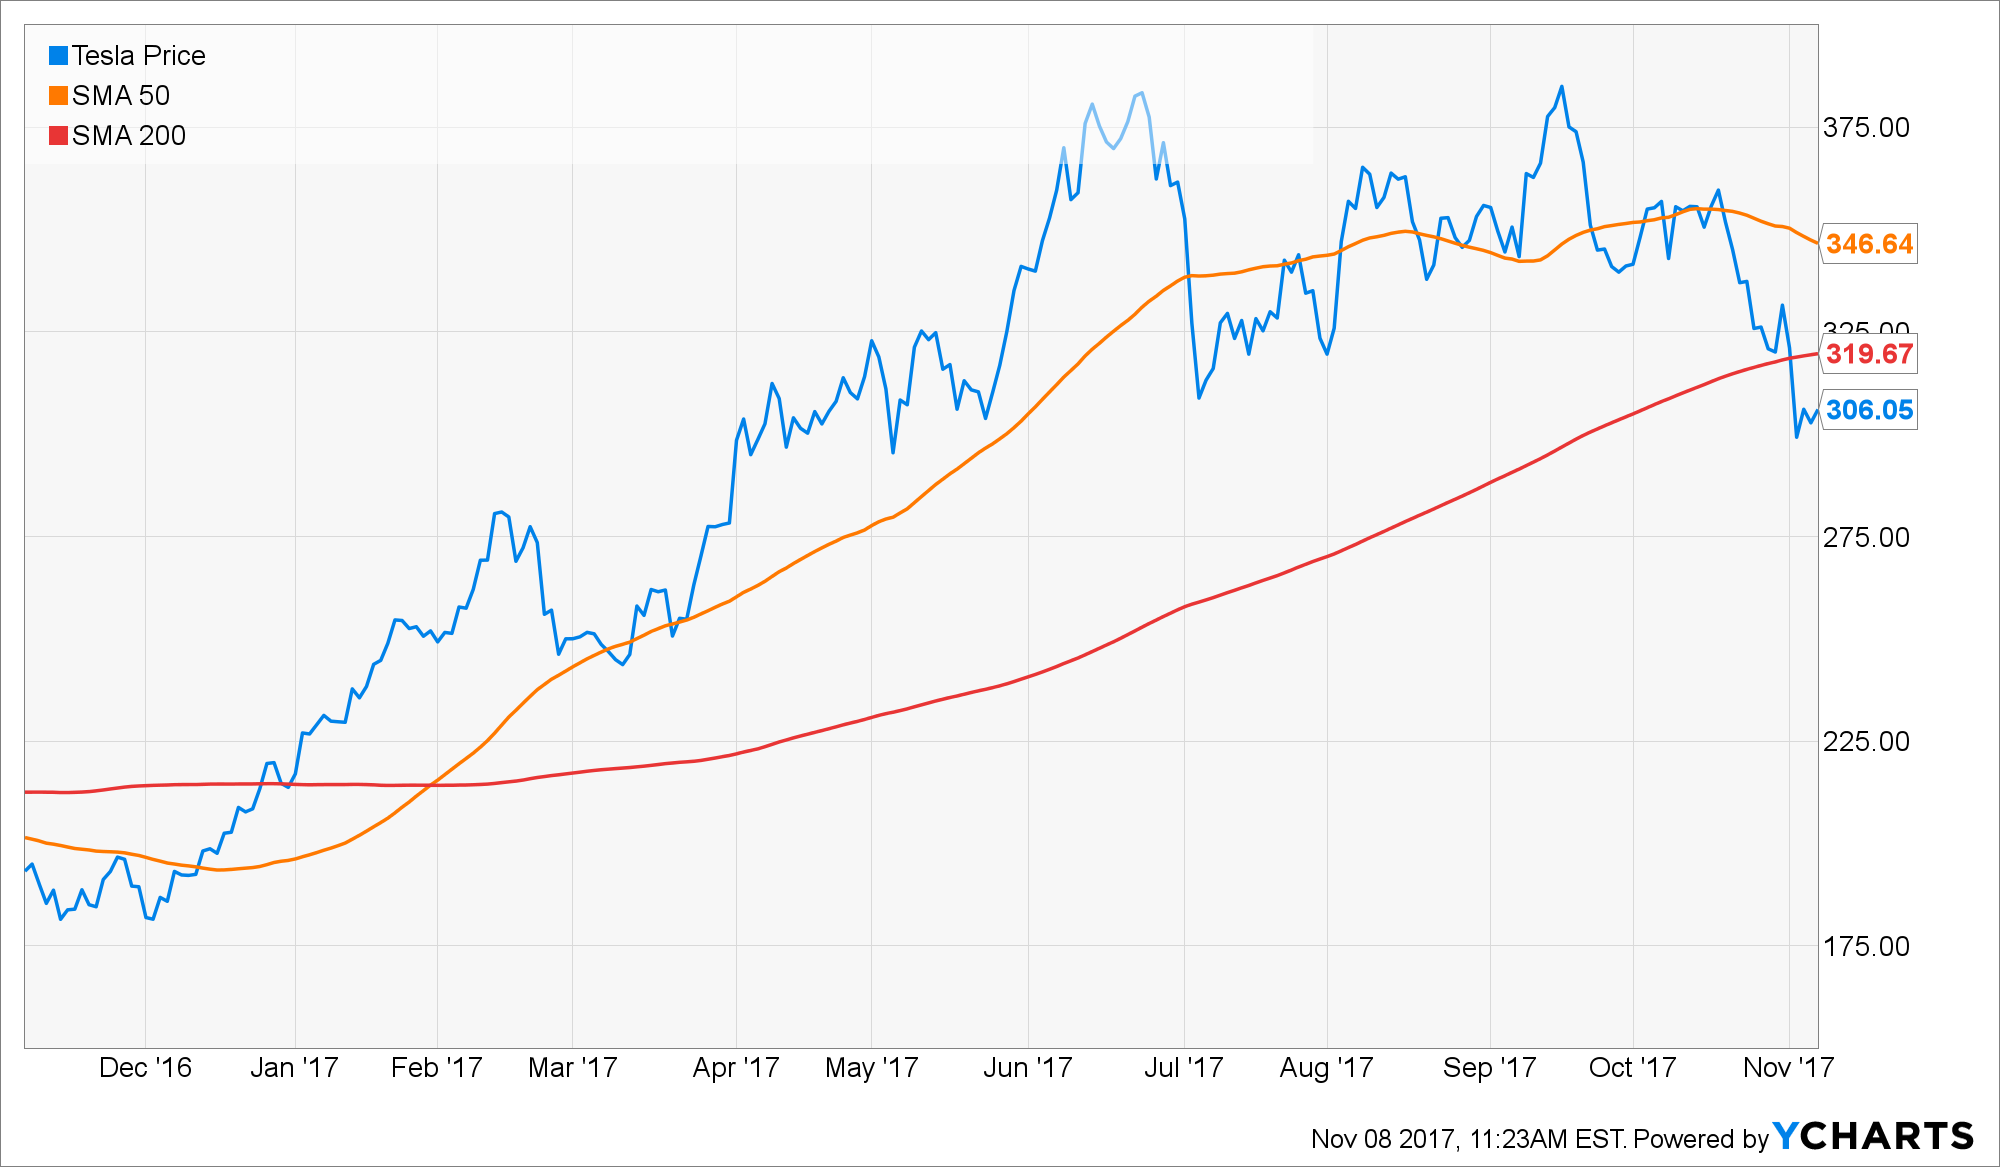
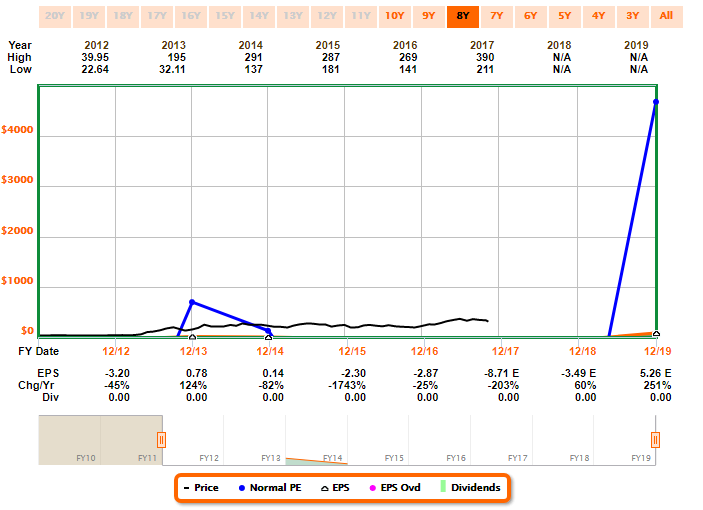
BH: I won’t give you a hard time on this trade considering your overall track record has been stellar as shown in our earlier performance table. Besides, Tesla has been disappointing from a fundamentals standpoint (as shown in the following FastGraph), and cyclical stocks in general are starting to make people nervous.
Athena: That’s interesting that people are getting nervous, as you say, but I’m an emotionless model. I don’t let emotions cloud my judgement. Besides, I typically hold my positions for only a few months or less, and market cycles don’t usually play out in that short of a time period.
BH: Fair enough, Athena. How about you Felix—what have you got for us?
Felix: I ran the 30 Dow Jones stocks through my model this week, and the following list includes the top ranked names.
BH: Thanks, Felix, and that’s interesting. I take it you are a momentum trader considering the names at the top of your list have been performing well this year.
Felix: I am a momentum trader, but I typically hold my positions for about 66-weeks, which is longer than the other traders. I exit when my price target is achieved. I also use macro factors and stops to control risks.
BH: It seems to me like you’re basically “chasing returns,” but I know there is a lot more to your strategy. I also know you have a very strong track record of performance. Plus, volatility is reduced significantly (and returns remain attractive) when your picks are combined with the other models’ picks. Thanks again for sharing your rankings.
Conclusion:
If you are worried about macroeconomic headwinds and market wide volatility, you might want to consider a blended approach. For example, there are benefits to blending our different trading models. And there are also benefits to blending our trading models with traditional long-term stocks. Specifically, they are less correlated thereby providing less volatility while also keeping returns high.
Stock Exchange Character Guide:
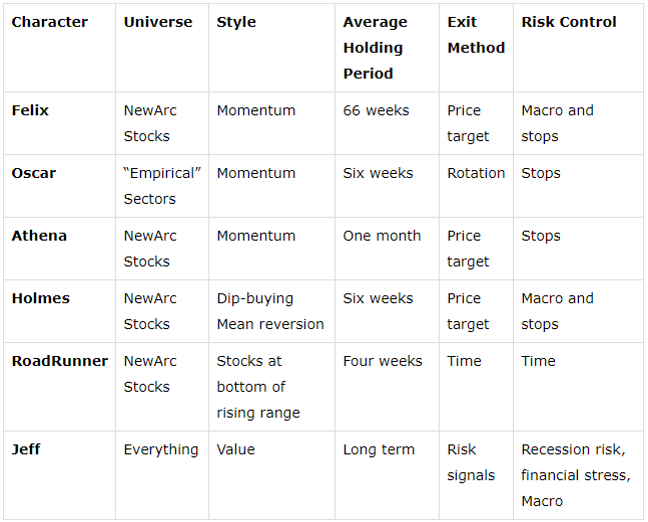
Background On The Stock Exchange:
Each week, Felix and Oscar host a poker game for some of their friends. Since they are all traders, they love to discuss their best current ideas before the game starts. They like to call this their “Stock Exchange.” (Check out Background on the Stock Exchange for more background). Their methods are excellent, as you know if you have been following the series. Since the time frames and risk profiles differ, so do the stock ideas. You get to be a fly on the wall from my report. I am usually the only human present and the only one using any fundamental analysis.
The result? Several expert ideas each week from traders, and a brief comment on the fundamentals from the human investor. The models are named to make it easy to remember their trading personalities.
Getting Updates:
Readers are welcome to suggest individual stocks and/or ETFs to be added to our model lists. We keep a running list of all securities our readers recommend, and we share the results within this weekly “Stock Exchange” series when feasible. Send your ideas to “etf at newarc dot com.” Also, we will share additional information about the models, including test data, with those interested in investing. Suggestions and comments about this weekly “Stock Exchange” report are welcome.

