Get 40% Off
🚨 Volatile Markets? Find Hidden Gems for Serious OutperformanceFind Stocks Now

Stellar Lumens Primed To Recover Lost Ground

Published 01/29/2021, 12:23 AM
Updated 05/08/2020, 11:50 AM

Stellar's XLM token is breaking out as several technical indicators have turned bullish.

Key Takeaways

  • Stellar is bound for a 45.50% upswing after breaking out of a descending triangle.
  • The parabolic SAR, MACD, and SuperTrend indicators add credence to the optimistic outlook.
  • Only a 4-hour candlestick close below $0.230 will jeopardize the bullish thesis described above.

Stellar’s market outlook seems to be improving in the aftermath of a three-week-long consolidation period.

Stellar Is Breaking Out

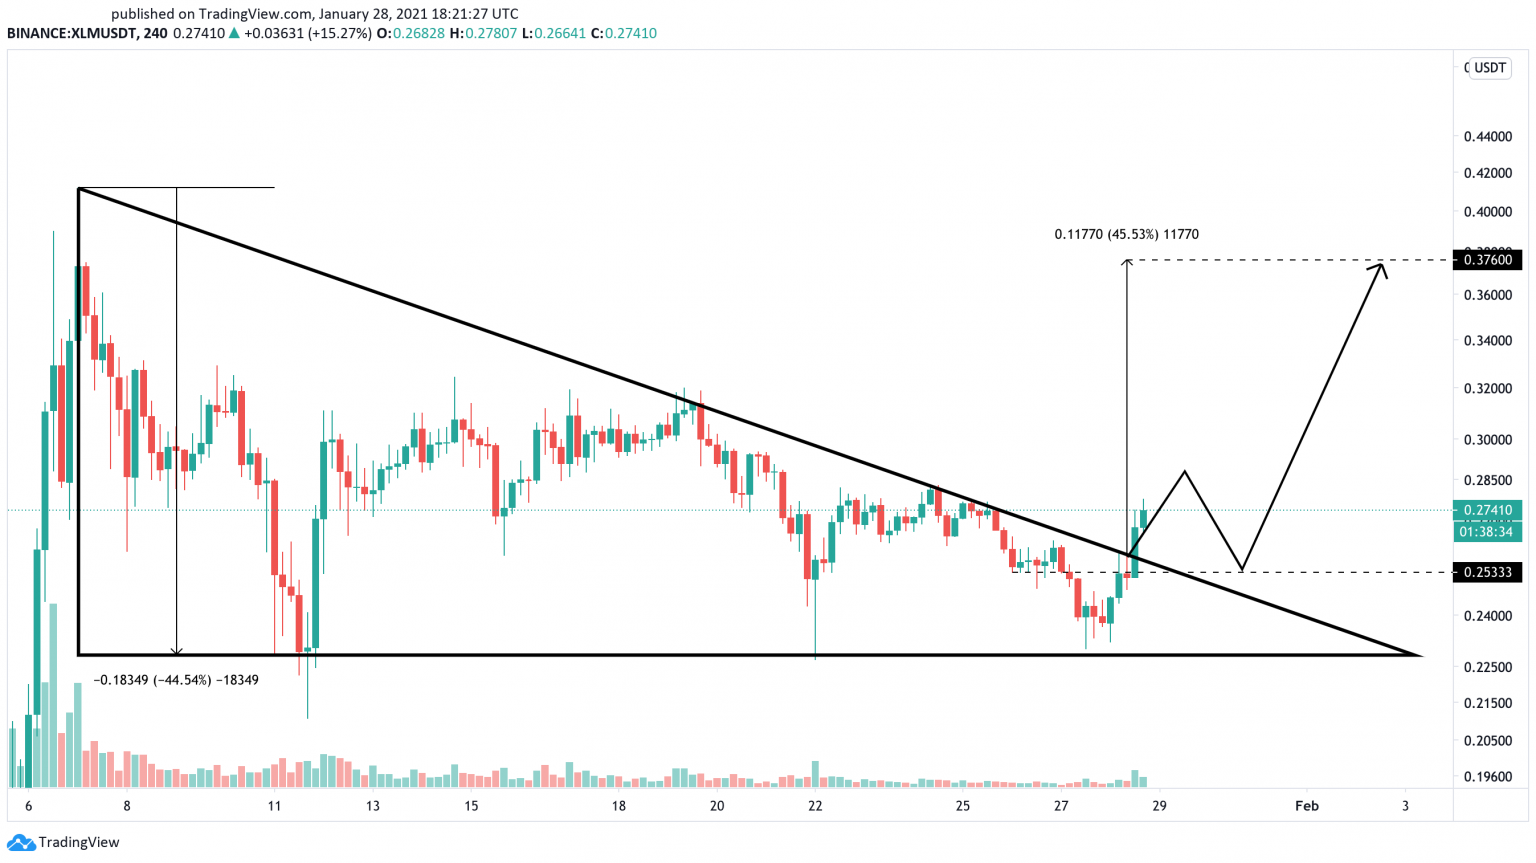
Stellar Lumens XLM) the eleventh-largest cryptocurrency by market cap, appears to be breaking out of a descending triangle that has been developing on its 4-hour chart since Jan. 7.

Since then, the price of XLM has been making a series of lower highs. Meanwhile, the $0.230 support level has been able to prevent the coin’s price from dropping further.

A recent spike in the buying pressure behind Stellar was significant enough to push the coin’s price through the triangle’s hypotenuse at $0.253. Now that XLM has regained this price hurdle as support, the chances for a 45.50% upswing to $0.376 have increased.
XLM/USD 240-Minute Chart

Stop and Reverse

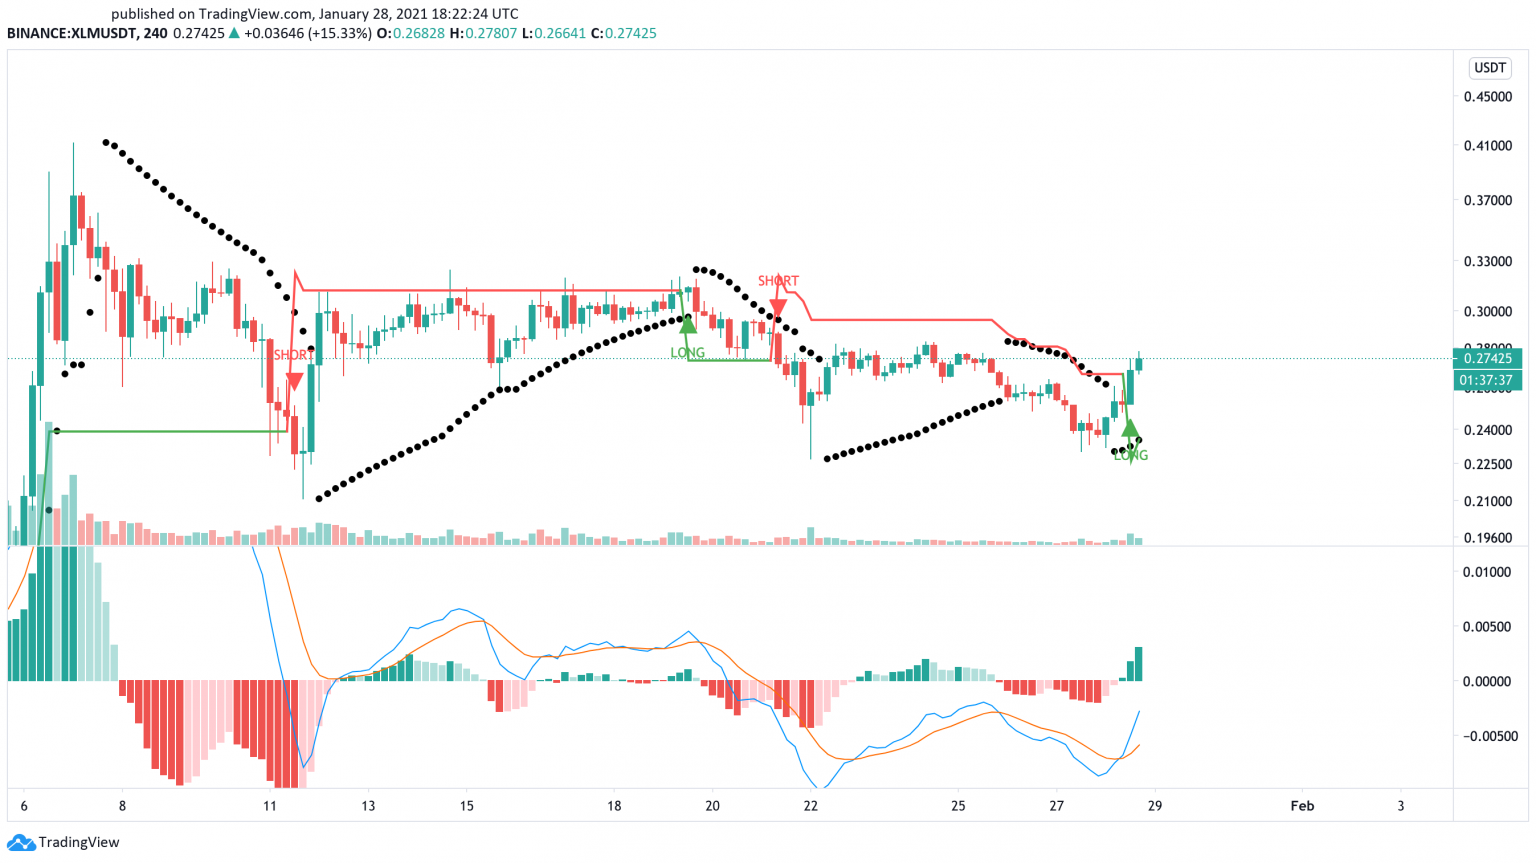
The parabolic stop and reverse, or “SAR,” adds credence to the optimistic outlook. This trend-following indicator forecasts that Stellar’s consolidation period came to an end.

Each time the stop and reversal points move below an asset’s price, that event is considered to be a positive sign. Therefore, the recent flip over suggests that XLM is poised to advance further.

The moving average convergence divergence, or MACD, also turned bullish following the golden cross between the 12 four-hour exponential moving average and the 26 four-hour exponential moving average. Meanwhile, the SuperTrend indicator flashed a “long” signal as Stellar sliced through the $0.253 resistance.

All of these technical indexes help validate the descending triangle’s price projection for XLM.
XLM/USD 240-Min Chart

Regardless, investors must remain cautious as the cryptocurrency market remains at risk of a painful correction.

A downswing below the $0.230 support level could invalidate the bullish thesis. That could cause the parabolic SAR and SuperTrend indicator to turn bearish, leading XLM to plummet toward $0.123.

Original Post

3rd party Ad. Not an offer or recommendation by Investing.com. See disclosure here or remove ads .

Latest comments

Risk Disclosure: Trading in financial instruments and/or cryptocurrencies involves high risks including the risk of losing some, or all, of your investment amount, and may not be suitable for all investors. Prices of cryptocurrencies are extremely volatile and may be affected by external factors such as financial, regulatory or political events. Trading on margin increases the financial risks.
Before deciding to trade in financial instrument or cryptocurrencies you should be fully informed of the risks and costs associated with trading the financial markets, carefully consider your investment objectives, level of experience, and risk appetite, and seek professional advice where needed.
Fusion Media would like to remind you that the data contained in this website is not necessarily real-time nor accurate. The data and prices on the website are not necessarily provided by any market or exchange, but may be provided by market makers, and so prices may not be accurate and may differ from the actual price at any given market, meaning prices are indicative and not appropriate for trading purposes. Fusion Media and any provider of the data contained in this website will not accept liability for any loss or damage as a result of your trading, or your reliance on the information contained within this website.
It is prohibited to use, store, reproduce, display, modify, transmit or distribute the data contained in this website without the explicit prior written permission of Fusion Media and/or the data provider. All intellectual property rights are reserved by the providers and/or the exchange providing the data contained in this website.
Fusion Media may be compensated by the advertisers that appear on the website, based on your interaction with the advertisements or advertisers.
© 2007-2024 - Fusion Media Limited. All Rights Reserved.