The fourth-largest automaker in the world Stellantis (NYSE:STLA) stock is the product of the $52 billion mergers between Peugeot and Fiat Chrysler to become a major electric vehicle (EV) powerhouse. The combined company owns popular brands Jeep, Chrysler, Dodge, Alfa Romero, Fiat, Maserati, Peugeot (OTC:PUGOY), Leasys, and Opel. Stellantis has big plans to enter the EV market as well as the robotic machines to assemble them. Rather than going all-in on electrification strategy as traditional U.S. automakers lead by General Motors (NYSE: NYSE:GM), the Company is pursuing a mild hybrid strategy of hybrid combustion and electric vehicles which provides immediate efficiency and fuel-cost savings with smaller carbon emissions. The Company-owned robotics subsidiary Comau also inked a deal with Tesla (NASDAQ:TSLA) install their automation assembly robotics in its Fremont facility to help bolster output. The incredibly low 3 P/E is offset with a large $26 billion debt load and recent production cuts due to the global chip shortage. Prudent investors looking for an alternative play on not just the European auto market and EVs but also the robotics for EV assembly can look for opportunistic pullbacks on shares of Stellantis.
Q1 FY 2021 Earnings Release
On May 5, 2021, Stellantis released its fiscal first-quarter 2021 results for the quarter ending March 2021. The Company reported an pro forma net revenues of €37 billion versus €36.2 billion consensus analyst estimates, up 14% year-over-year (YoY). Pro forma consolidated shipments grew 11% YoY to 1.567 million units.
The Company had commercial launches of the Opel Mokka in March 2021 to European customers. The Jeep Grand Wagoneer and next-gen Jeep Cherokee production remains on track for late Q2 2021 and Q3 2021. At the end of March 2021, the Company had 1.234 million units as dealer inventories are down due to the global chip shortage.
2021 Guidance and Outlook
Stellantis maintains 2021 guidance with Adjusted Operating Income Margin between 5.5% to 7.5%, assuming no COVID-19 related lockdowns. For 2021, the industry outlook remains unchanged with North America +8%, South America +20%, Europe + 10%, Middle East & Africa +15% (up from 3%), India & Asia Pacific +10% (up from 3%) and China +5%. The Company has scheduled an Electrification Day event on July 8, 2021.
Comau Robotics Deal
On May 7, 2021, Stellantis-owned robotics company Comau Robotics in a deal with Tesla to set-up automation equipment to manufacture automobiles at the Tesla Fremont Factory in Northern California. The Tesla Fremont factory is the only one that assembles all four models of Tesla.
Chip Shortage Effects
On May 14, 2021, Bloomberg reported that Stellantis plans on cutting over 1,600 jobs at its Illinois Jeep plant due to the global semiconductor shortage. The Company will be cutting its second shift at its Belvidere plant by July 26, 2021 to balance sales with production. Jeep Cherokees sales fell 29% YoY in 2020 while overall Jeep brand deliveries dropped 14% during the pandemic. Recovery has been slow and the chip shortage hasn’t been helping.
Valuation
Shares are trading at a P/E of 3.10 compared to rivals General Motors at a P/E of 10 and Ford at a P/E of 11. The Company plans on tripling it sales of EVs and plans to have EV and hybrid EV versions of all its models in Europe by 2025. Prudent investors can monitor for opportunistic pullback levels in this undervalued hybrid EV and robotics play.

STLA Opportunistic Pullback Levels
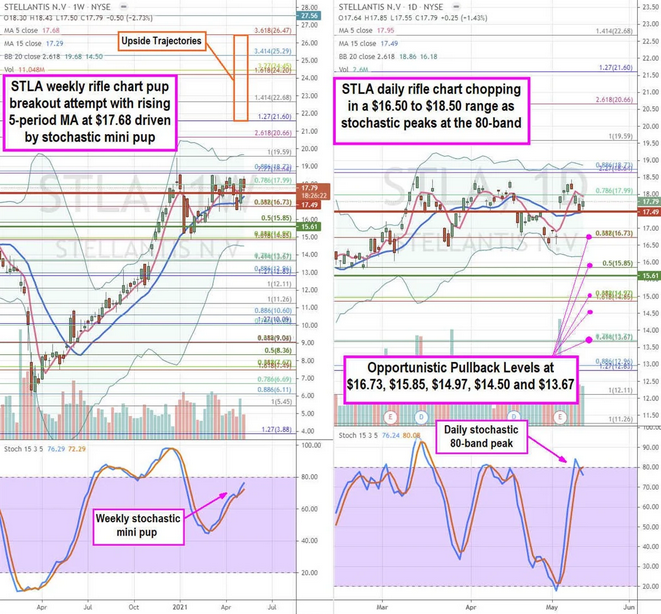
Using the rifle charts on the weekly and daily time frames provide a precision view of the price action playing field for STLA stock. The weekly rifle chart is attempting to form a pup breakout with a flat 5-period moving average (MA) at $17.68 and rising 15-period MA at $17.29 powered by the stochastic mini pup. The weekly upper Bollinger Bands (BBs) sit near the $19.59 Fibonacci (fib) level.
The weekly market structure high (MSH) sell triggers under $17.49. The daily rifle chart has been chopping in a two-month range between $16.50 to $18.50. The daily 5-period MA is sloping down at $17.95 as the stochastic peaks again at the 80-band.
The daily BBs have been flat as well setting up for a break either way. The daily market structure low (MSL) buy triggered above $15.61. Prudent investors can look for opportunistic pullback levels at the $16.73 fib, $15.85 fib, $14.97 fib, $14.50 sticky 5s level, and the $13.67 fib. The upside trajectories range from the $21.60 fib up to the $26.47 fib. It’s prudent to keep an eye on the major automakers GM and Ford (NYSE:F) stocks as these tend to move together.
