Get 40% Off
🚨 Volatile Markets? Find Hidden Gems for Serious OutperformanceFind Stocks Now

State Street Corporation Preparing To Develop A Bullish Trend

Published 12/02/2020, 07:24 AM
Updated 07/09/2023, 06:31 AM

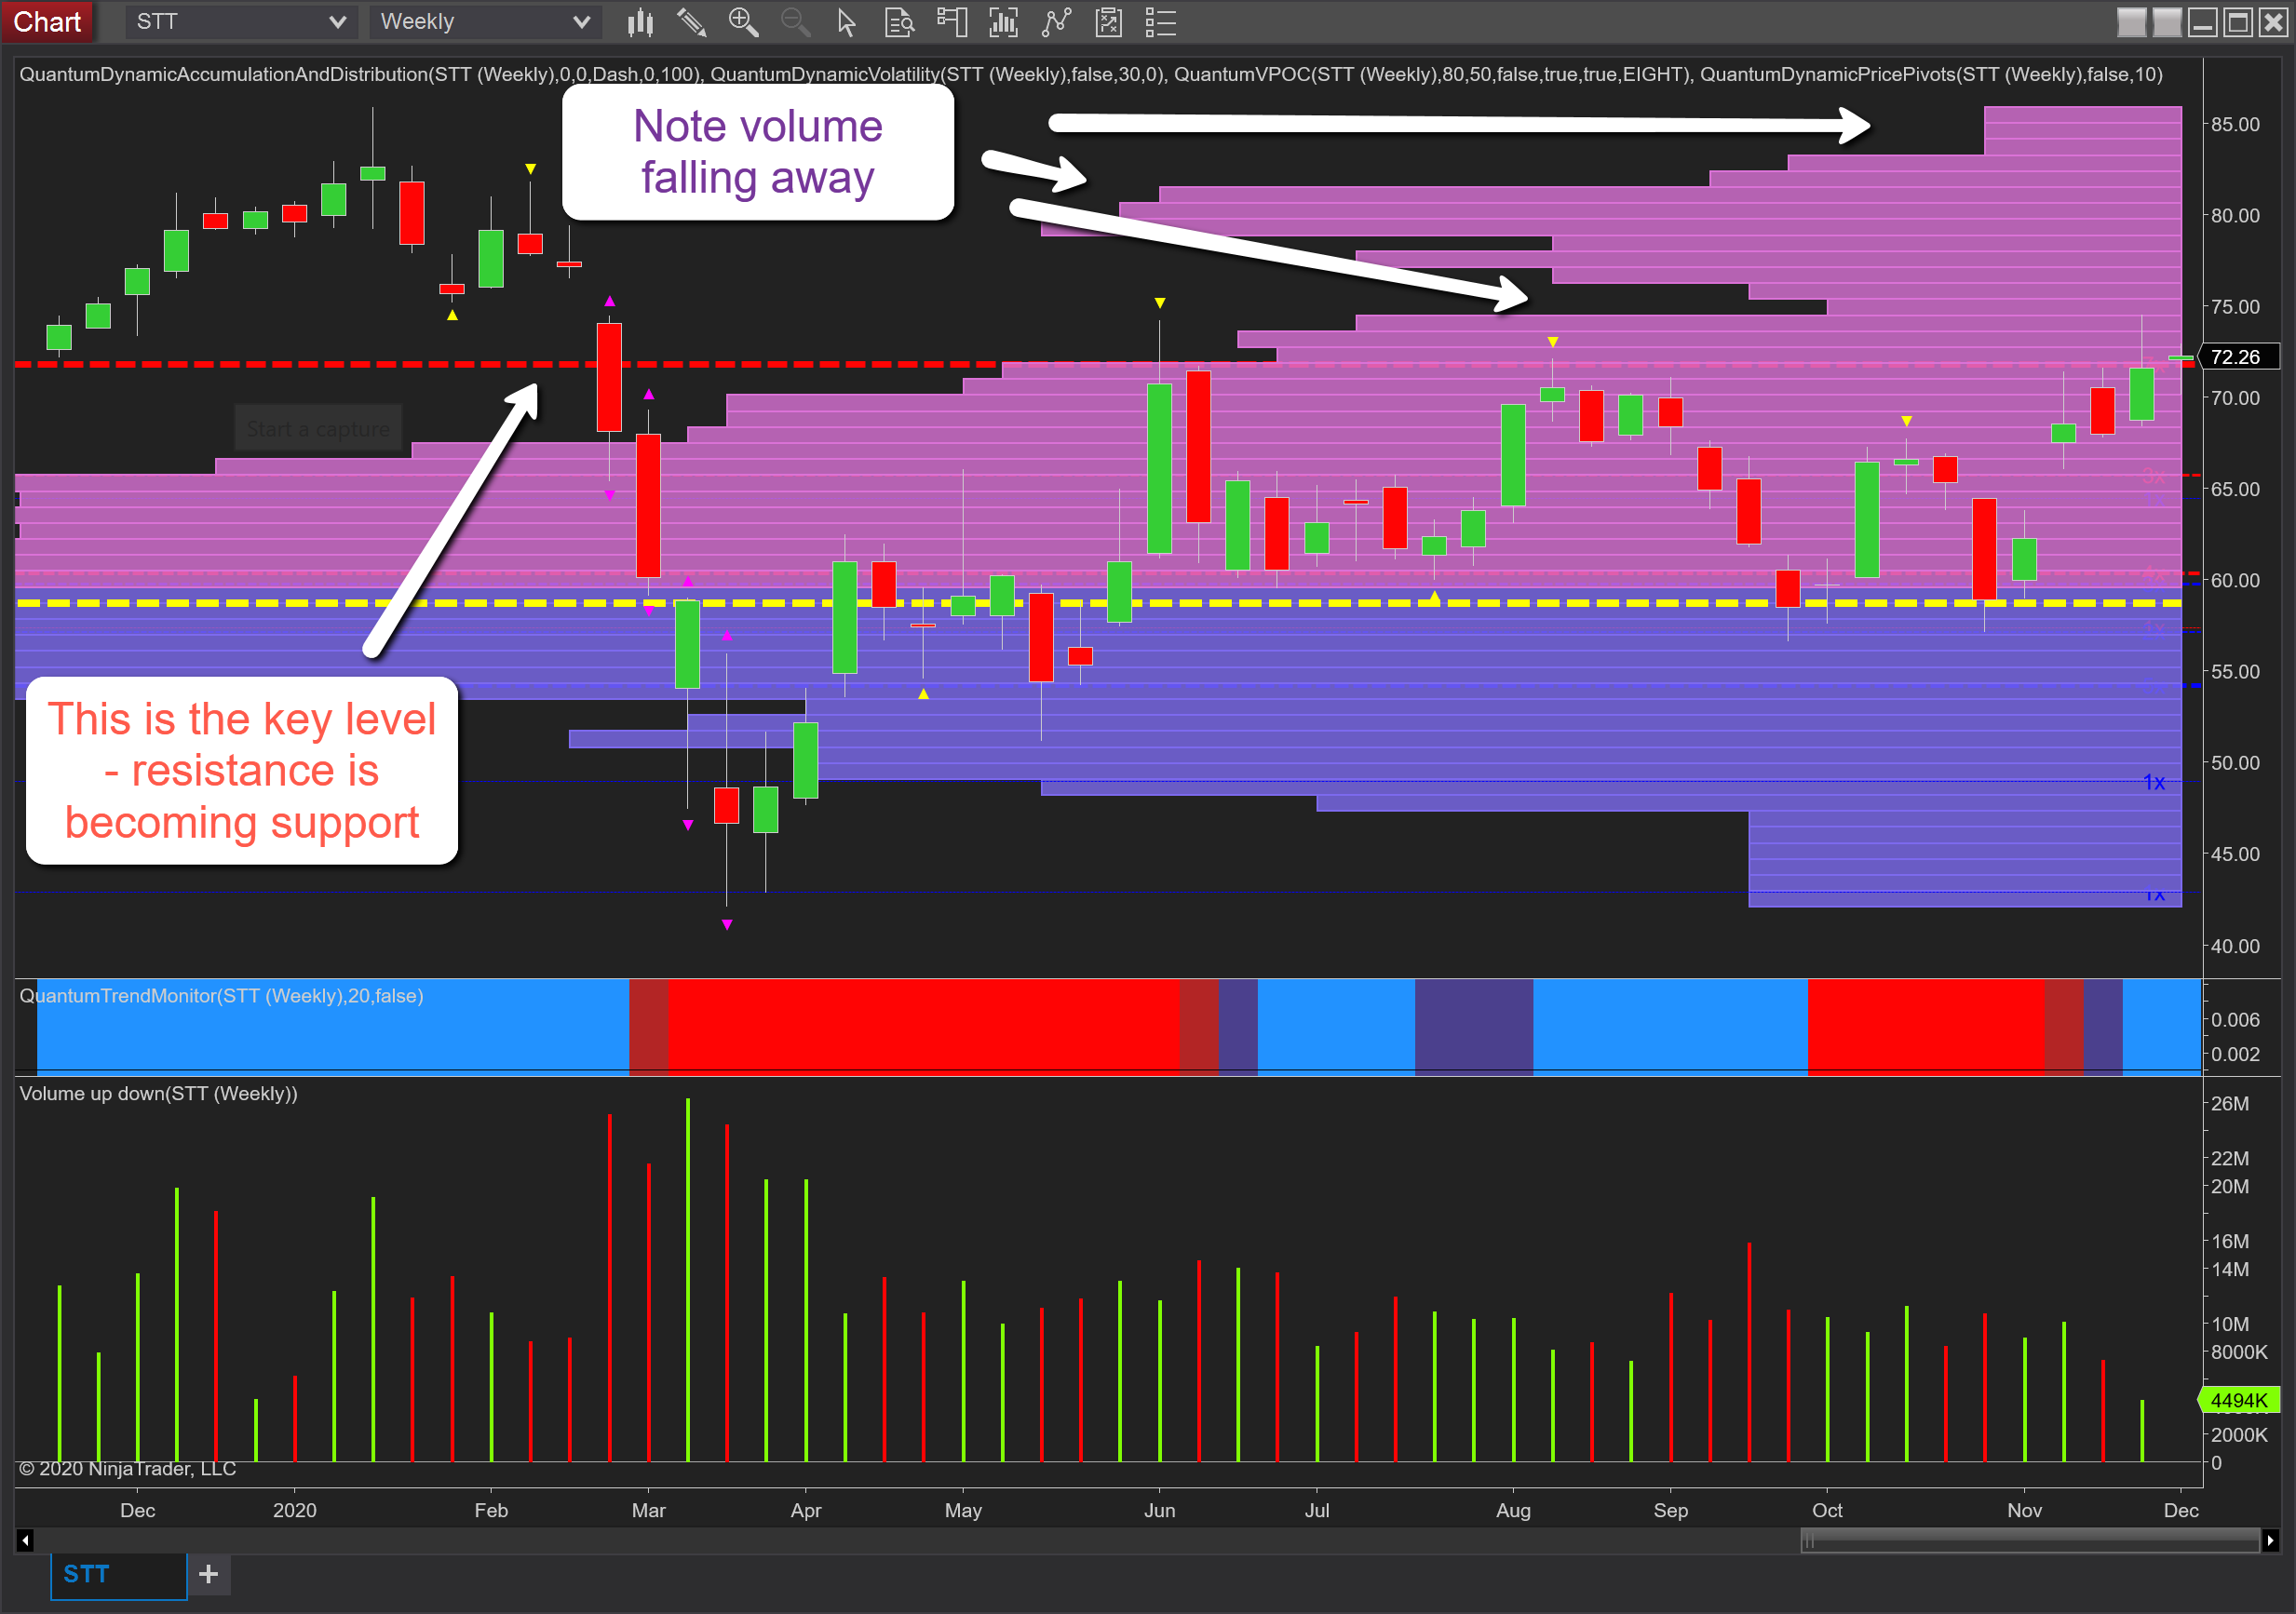
The weekly chart for State Street (NYSE:STT), one of the oldest banks in the US and headquartered in Boston, is now approaching an interesting point and for longer-term investors certainly, one to add to the watch list and once again this chart is all about levels, and in particular that at $72 per share which is the one which catches the eye.
STT-Weekly Chart

The accumulation and distribution indicator presents these levels for us according to the number of times they have been tested and retested, and rather like Popeye and his spinach, each time they are tested and hold, the indicator increases their thickness giving us a clear and immediate picture of key support and resistance levels. In this case, it is one of resistance that has capped this stock repeatedly since early summer, whilst the VPOC, (the volume point of control) the yellow dashed line, has provided an equally strong level of support along with other minor levels adding their own weight.

Yesterday’s price action saw the stock hold above the ceiling of resistance before closing at $72.26, and in so doing, gives the first hint that this level is about to be breached decisively and if so, we then have an extremely broad platform of support in place below to act as a springboard for a sustained move higher in the longer term with a move towards $85 per share and beyond.

As we can see volume-based resistance on the VPOC histogram falls away as we move towards $75 per share with a low volume node here and hence we can expect to see the price move easily through this region and on towards $80 per share where historic volume builds once more. So in summary, a stock that has the potential to move firmly higher in the medium term provided we hold above the old ceiling of resistance and is associated with rising volume as the trend develops.

3rd party Ad. Not an offer or recommendation by Investing.com. See disclosure here or remove ads .

Latest comments

Risk Disclosure: Trading in financial instruments and/or cryptocurrencies involves high risks including the risk of losing some, or all, of your investment amount, and may not be suitable for all investors. Prices of cryptocurrencies are extremely volatile and may be affected by external factors such as financial, regulatory or political events. Trading on margin increases the financial risks.
Before deciding to trade in financial instrument or cryptocurrencies you should be fully informed of the risks and costs associated with trading the financial markets, carefully consider your investment objectives, level of experience, and risk appetite, and seek professional advice where needed.
Fusion Media would like to remind you that the data contained in this website is not necessarily real-time nor accurate. The data and prices on the website are not necessarily provided by any market or exchange, but may be provided by market makers, and so prices may not be accurate and may differ from the actual price at any given market, meaning prices are indicative and not appropriate for trading purposes. Fusion Media and any provider of the data contained in this website will not accept liability for any loss or damage as a result of your trading, or your reliance on the information contained within this website.
It is prohibited to use, store, reproduce, display, modify, transmit or distribute the data contained in this website without the explicit prior written permission of Fusion Media and/or the data provider. All intellectual property rights are reserved by the providers and/or the exchange providing the data contained in this website.
Fusion Media may be compensated by the advertisers that appear on the website, based on your interaction with the advertisements or advertisers.
© 2007-2024 - Fusion Media Limited. All Rights Reserved.