I last wrote about the FAANGs and FNGU and what I was monitoring in my post of early November 2018.
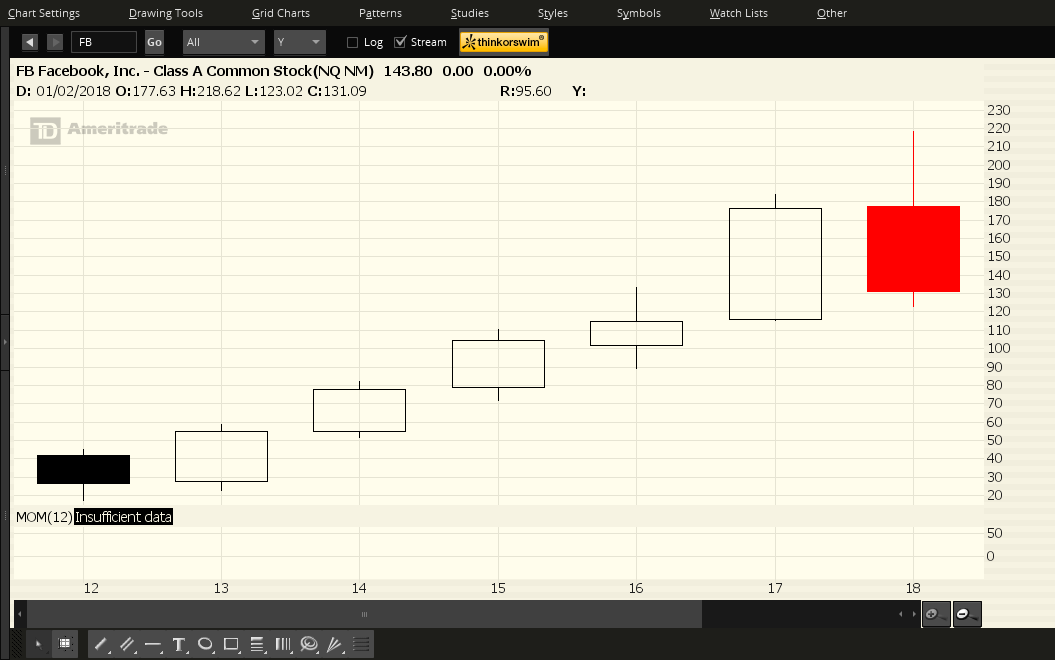
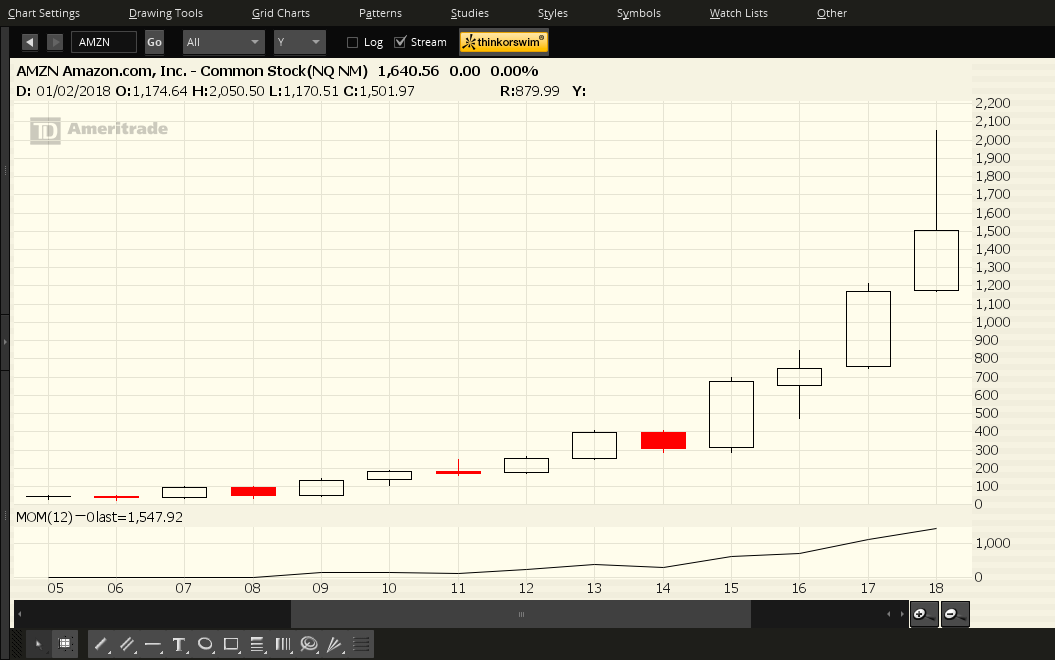
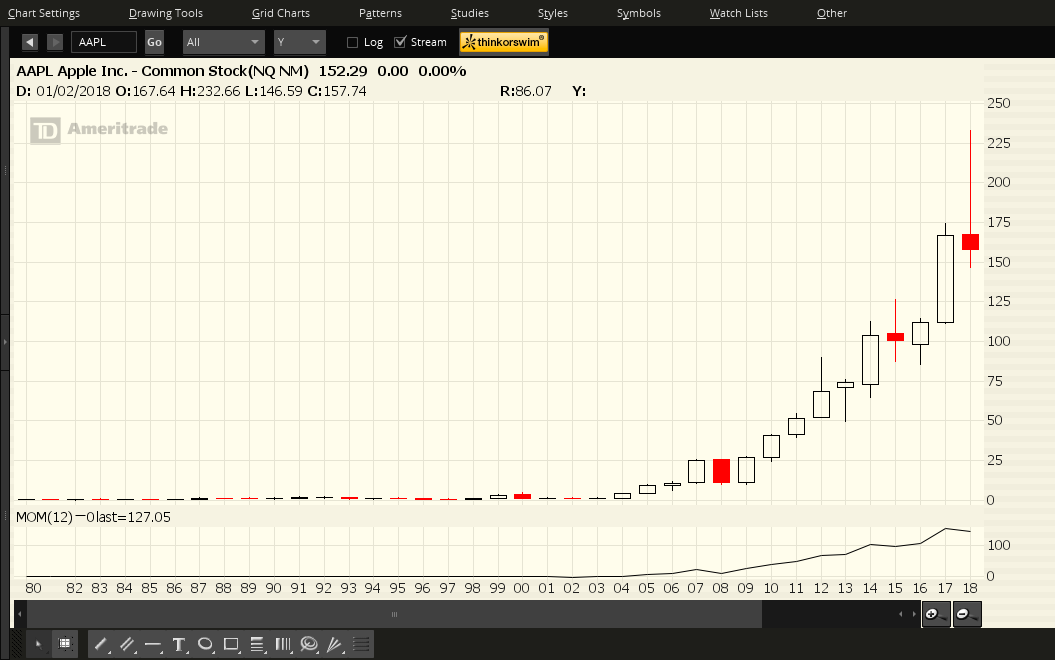
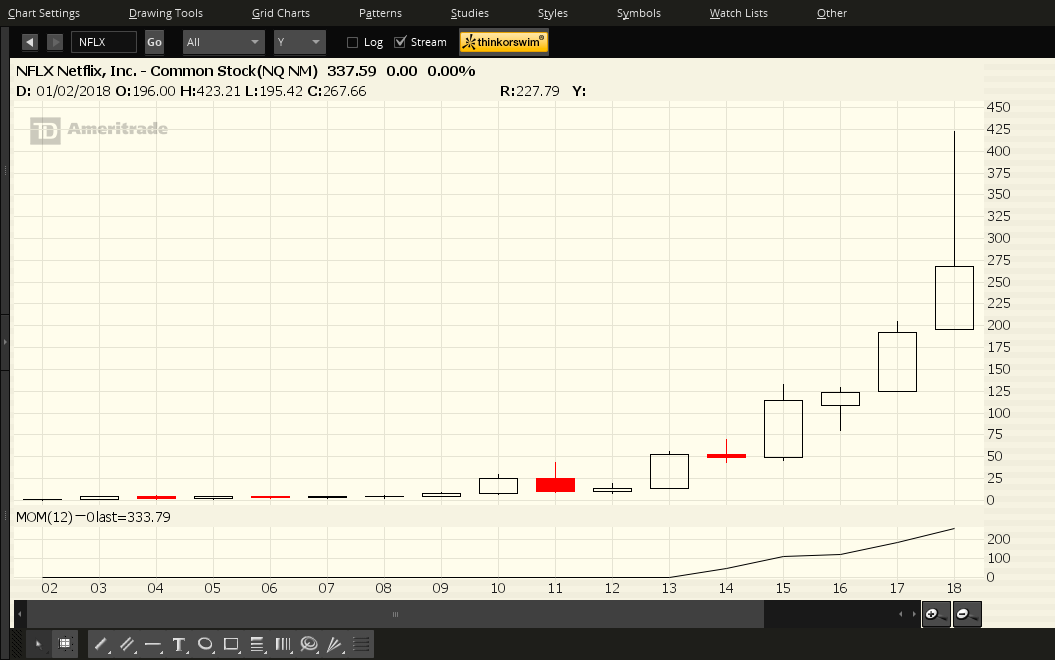
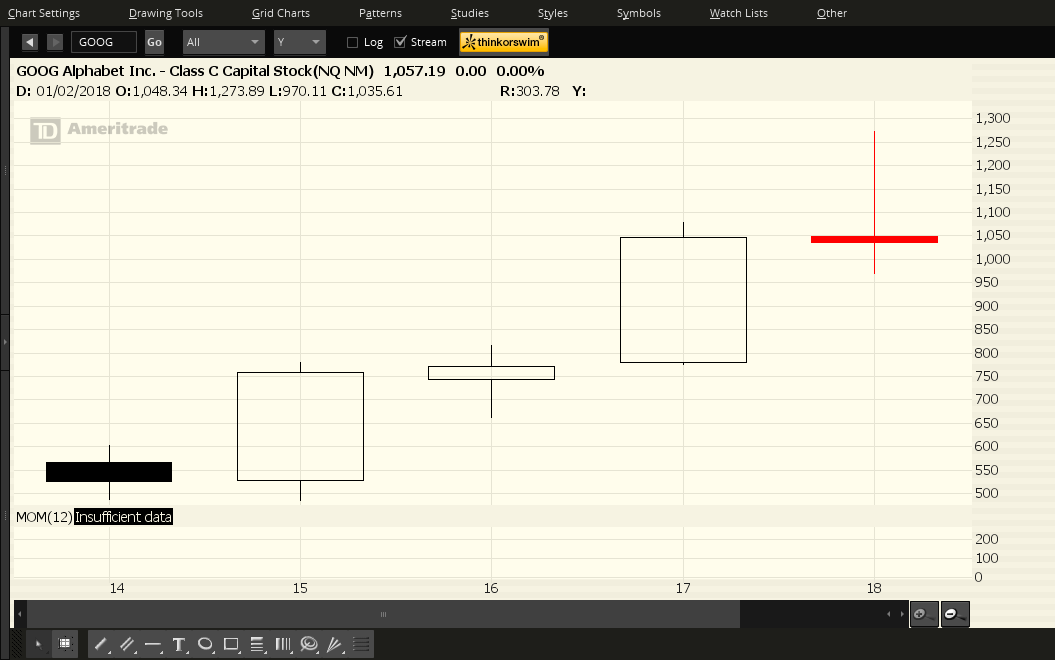
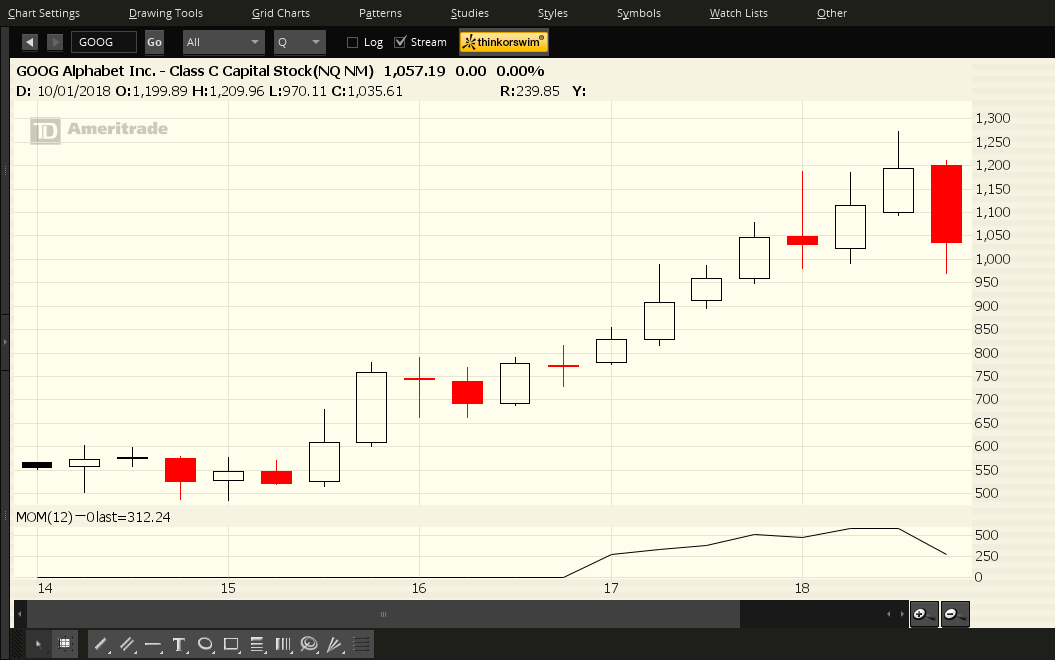
2018 was the year we saw the FAANGs form bearish shooting stars. Each candle on the following charts of Facebook Inc (NASDAQ:FB), Amazon (NASDAQ:AMZN), Apple (NASDAQ:AAPL), Netflix (NASDAQ:NFLX) and Alphabet (NASDAQ:GOOG) represents a period of one year (absent on these charts is 2019's candle, as I've left it off to illustrate last year's weakness and volatility compared with prior years in these stocks).
You can see, at a glance, that FB is the weakest of the five, as it has erased almost all of its 2017 gains, as well as its gains last year.
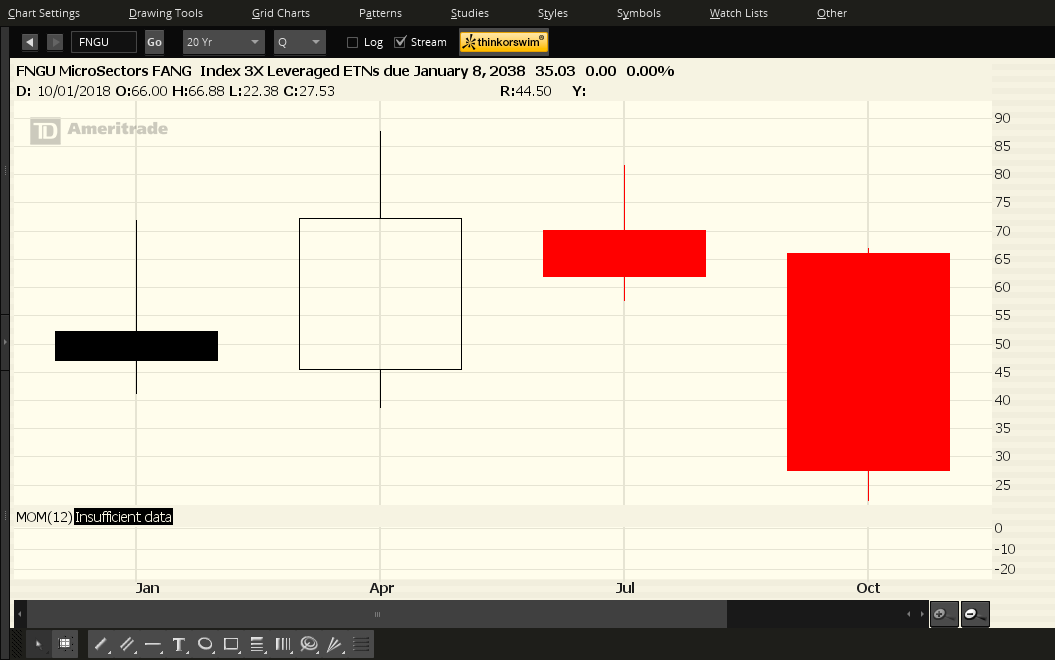
Each candle on the following chart of the BMO REX MicroSectors FANG Index 3X Leveraged ETF (NYSE:FNGU) represents a period of one quarter. Also absent on this chart is 2019's Q1 candle.
FNGU is an exchange traded note that tracks 3x the daily price movements of an index of US-listed technology and consumer discretionary companies...the index is highly concentrated and equally weighted. It is comprised of the 5 FAANG stocks + 5 tech stocks, namely, Alibaba (NYSE:BABA), Baidu (NASDAQ:BIDU), NVIDIA (NASDAQ:NVDA), Tesla (NASDAQ:TSLA) and Twitter (NYSE:TWTR).
As of the end of last year, it had erased all of its gains since it began trading in January 2018, and more.
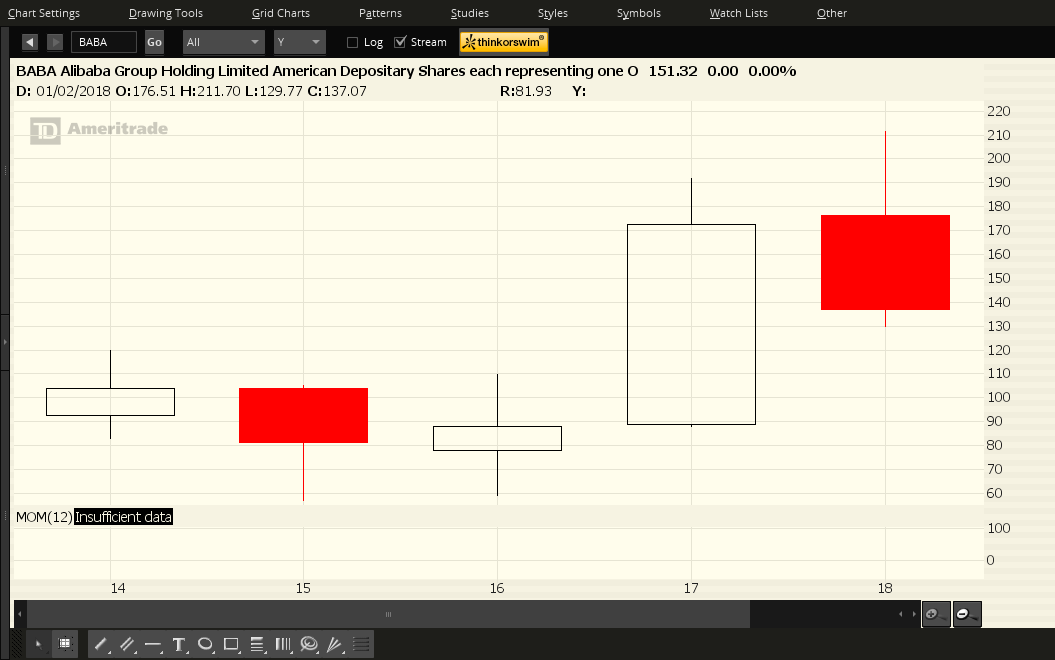
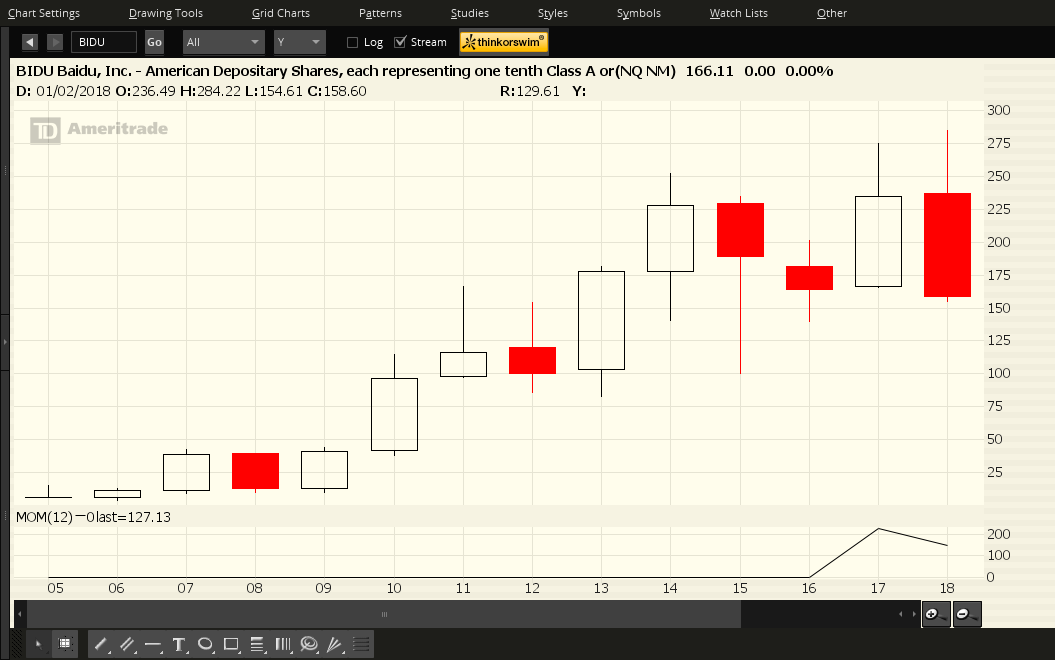
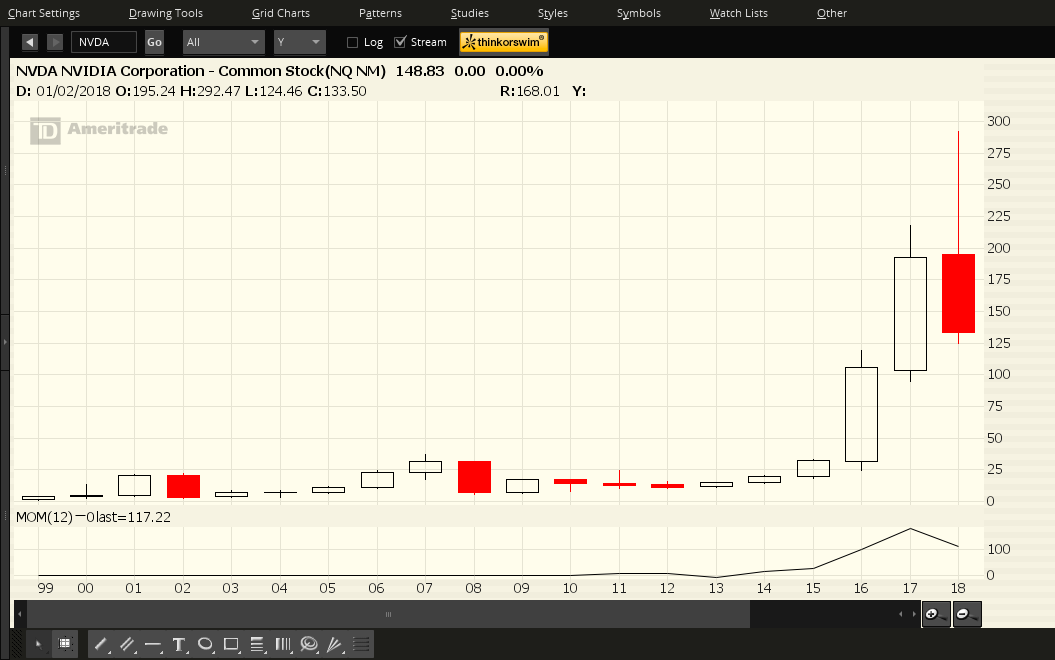
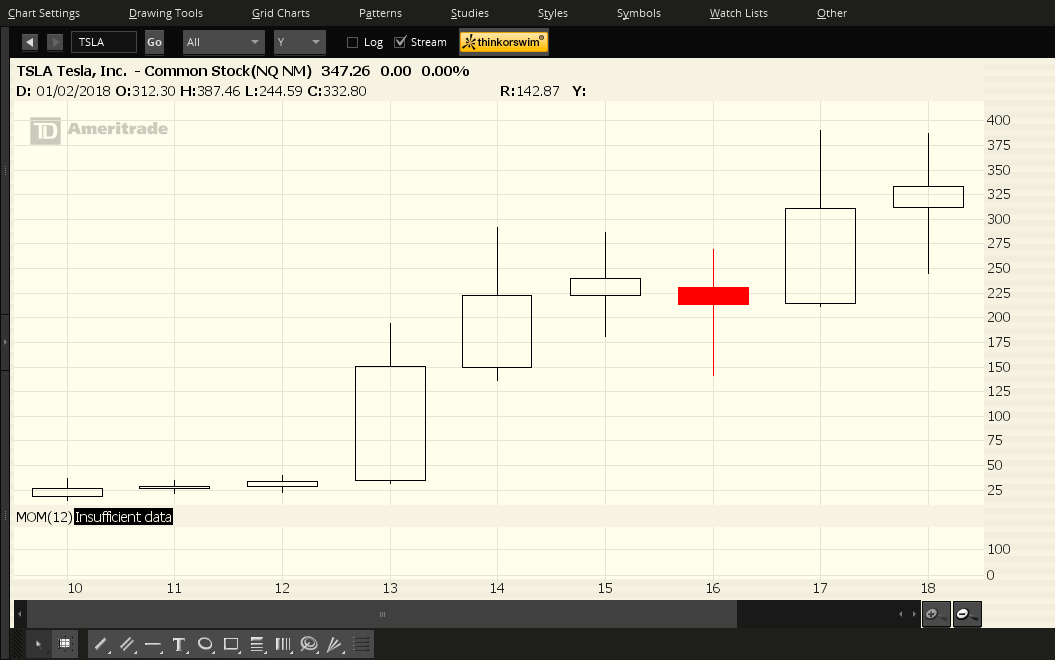
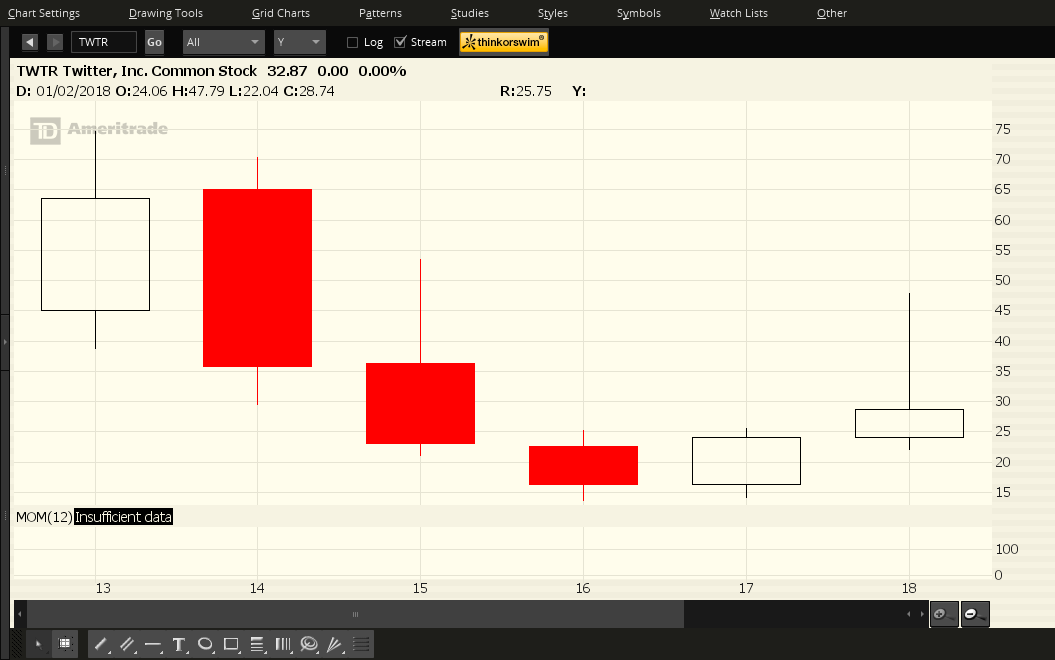
Each candle on the following charts of BABA, BIDU, NVDA, TSLA and TWTR represents a period of one year. Also absent on these charts is 2019's candle.
None of these stocks had a good year in 2018, either. In fact, BIDU has lost all of its gains made since 2014 and has taken a bite out of gains made in 2013, and TWTR closed out the year still lower than its IPO price in 2013.
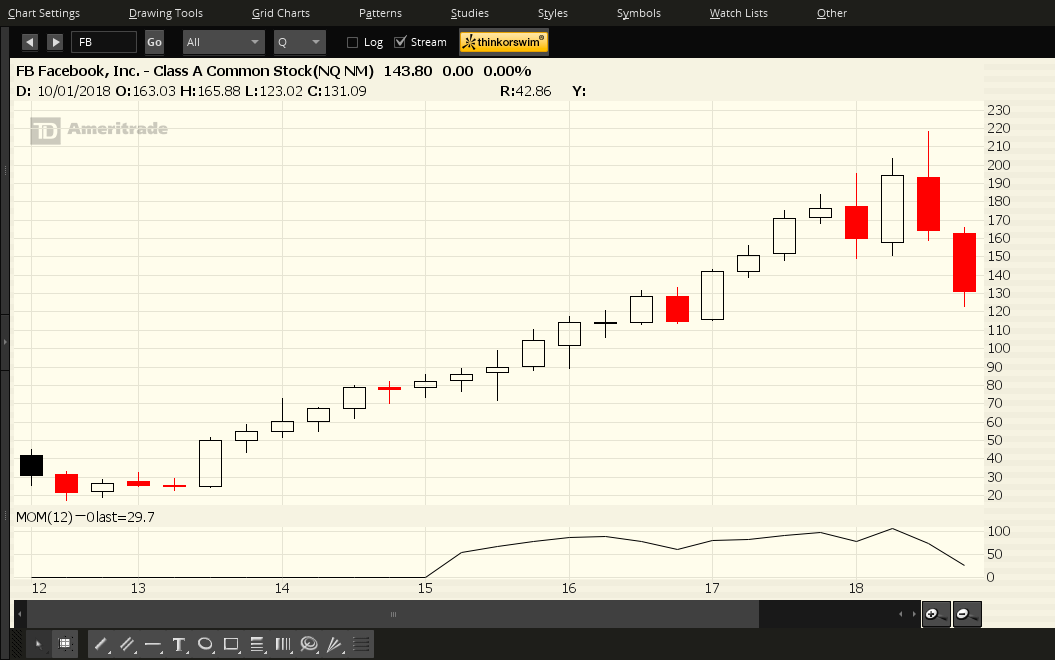
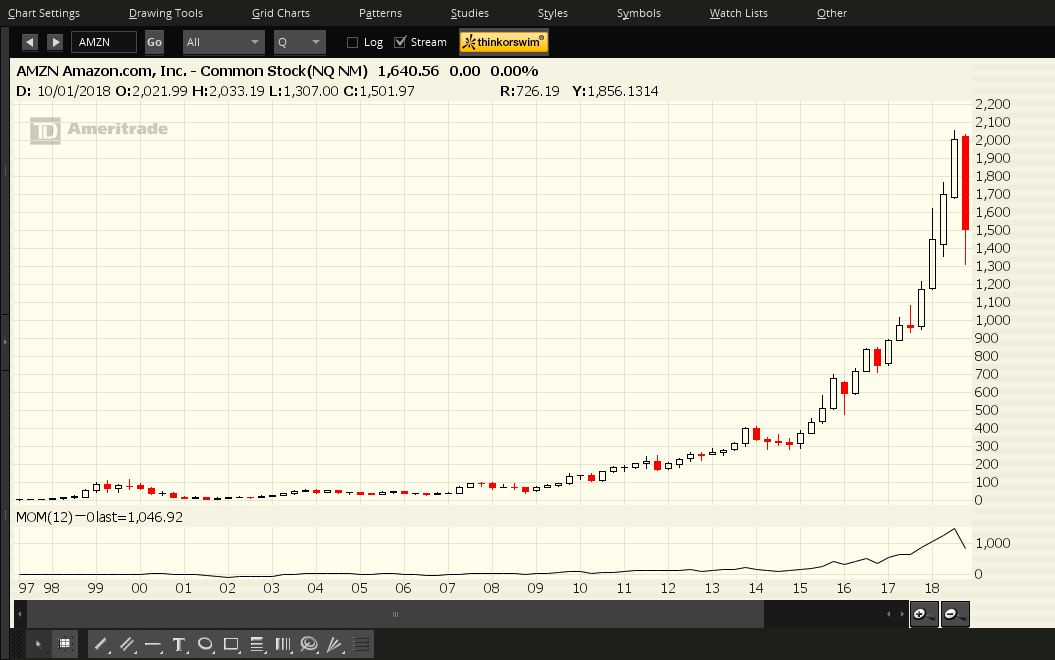
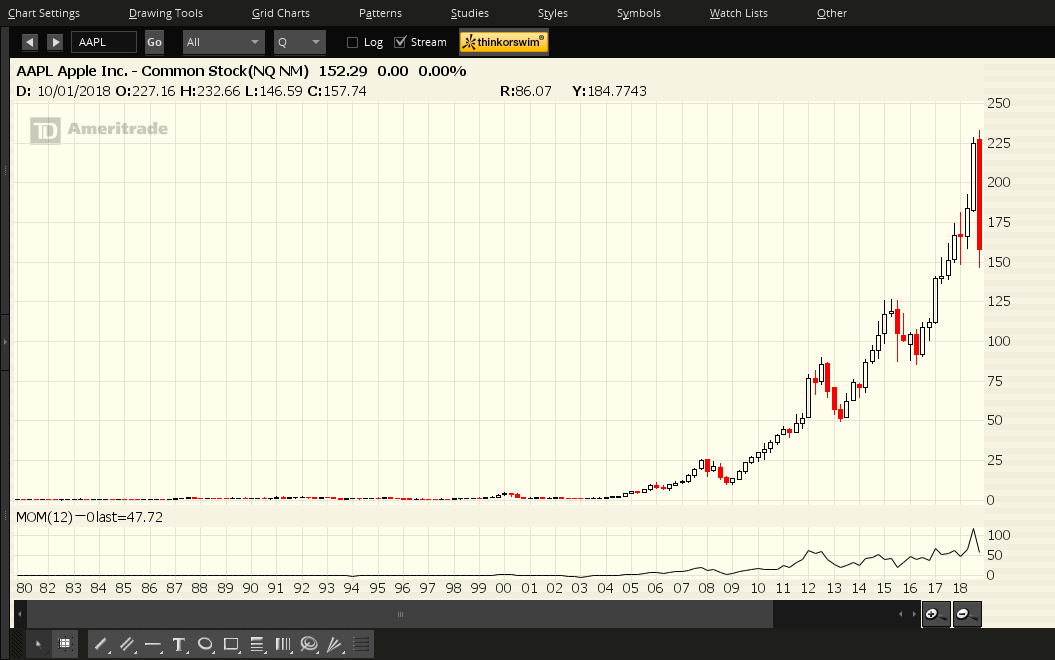
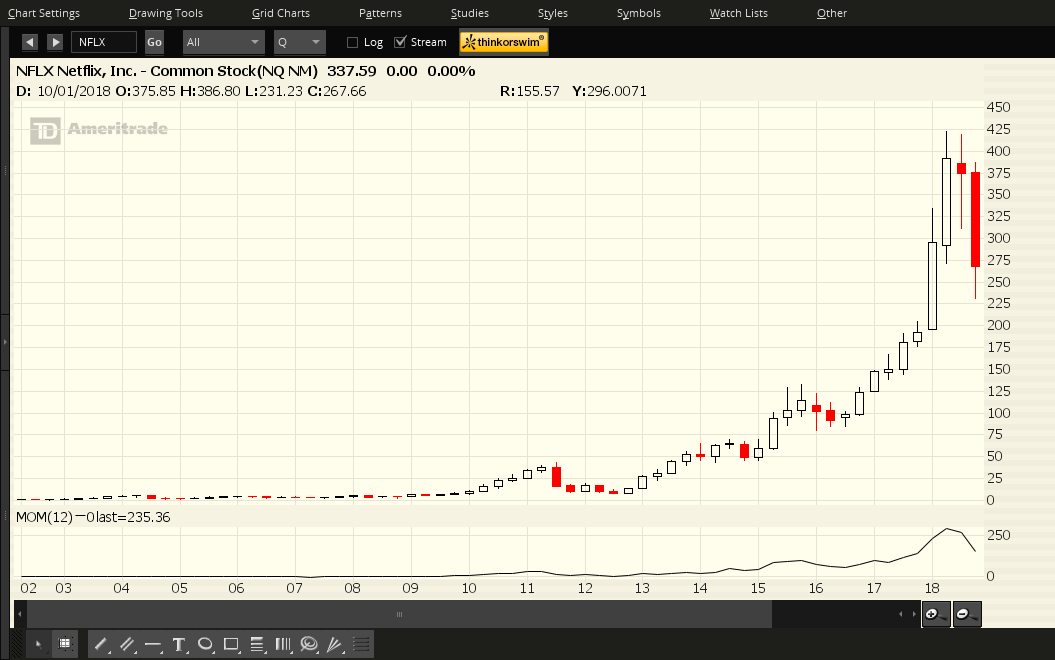
Each candle on the following charts of the FAANGs represents a period of one quarter. Also absent on this chart is 2019's Q1 candle.
We've seen the FAANGs lead the equity markets higher prior to Q4 of 2018 (and Q3 in the case of FB and NFLX), then lead them lower during Q4.
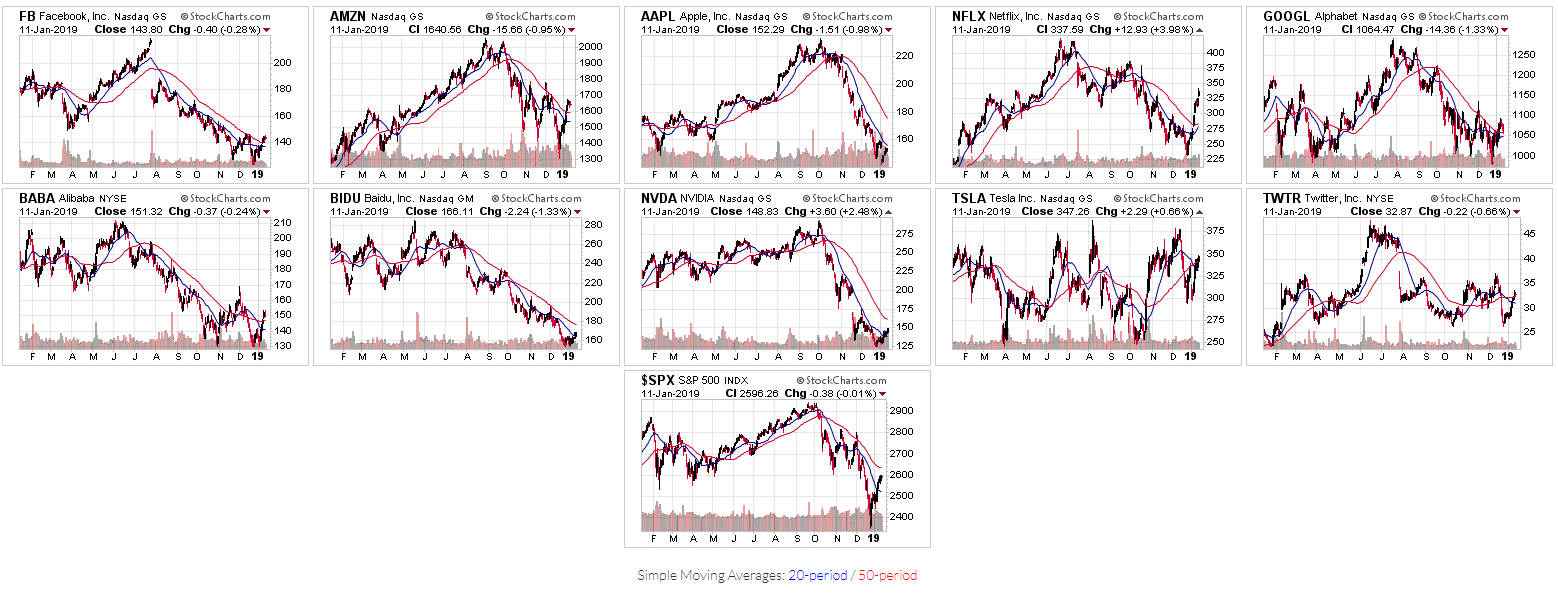
There's been some short covering in all 10 stocks, so far, in 2019 as shown on the following 1-Year daily charts (including FNGU and the SPX).
However, it remains to be seen whether prolonged and serious buying will continue in these stocks so as to propel them to reclaim a leadership role, once again...or whether this is just a short-term dead-cat bounce. I'd keep a close watch on FB, AAPL and GOOG, in particular, as further weakness could have a knock-on effect on some (or all) of these, as well as equities, in general.
We'll also see how much longer TWTR can survive, whether BIDU will ever make a comeback...and, whether FNGU will continue to trade much longer if general weakness persists in its 10 stocks.
