Moving Average
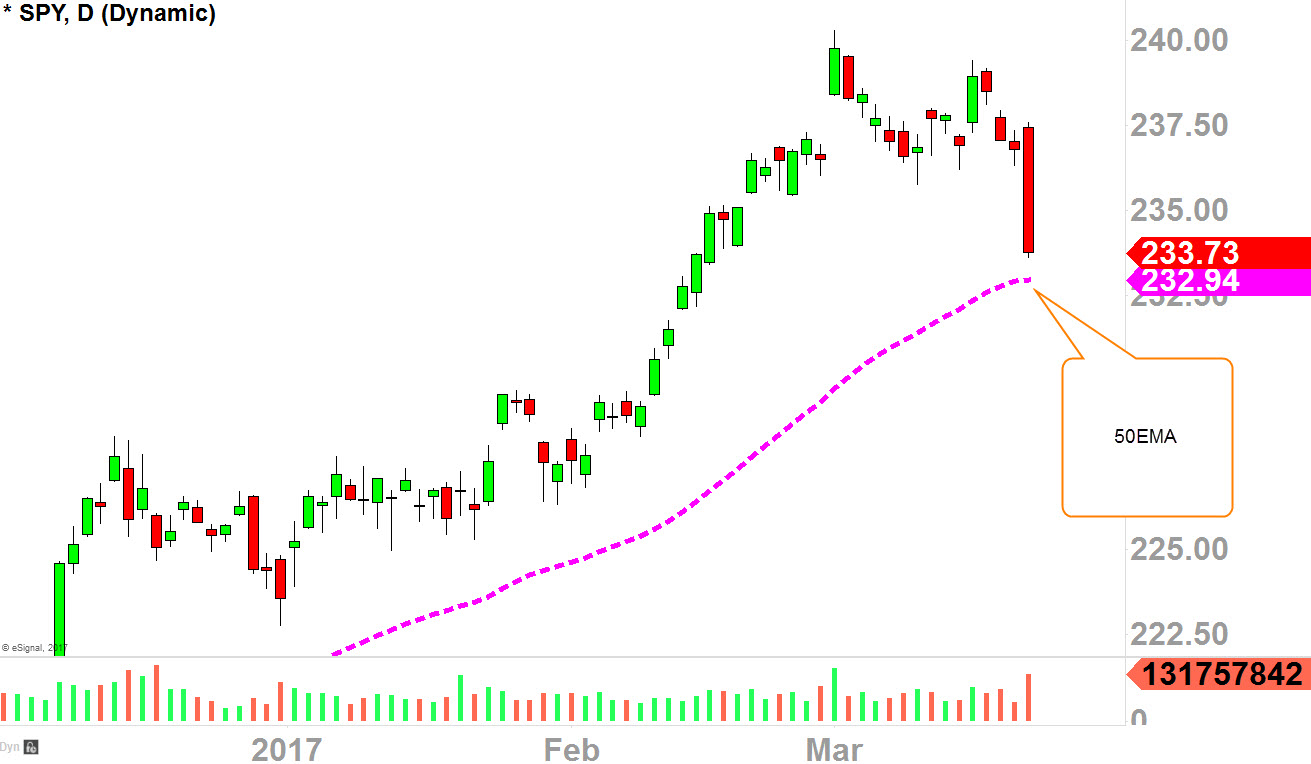
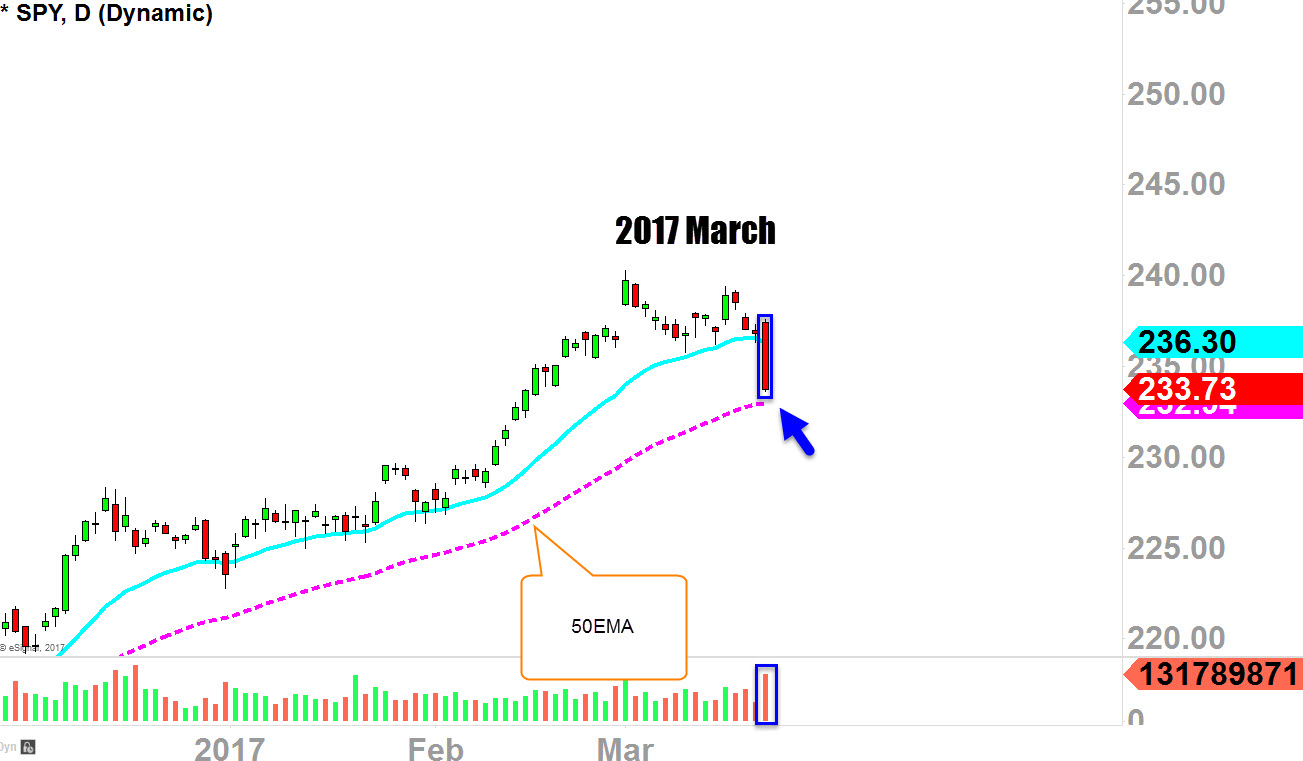
SPDR S&P 500 (NYSE:SPY) is down -1.28% (biggest down day this year) today, as, finally, we've lost 20EMA to the downside which I've been talking about all through out this year.
This means minor-term sentiment has now turned to bearish.
However I don't believe this is the end of the bull rally, but rather, a pullback within an uptrend before resuming that uptrend.
Currently "50EMA" is residing at 232.94, and that's the level we might see some short-term bounce.
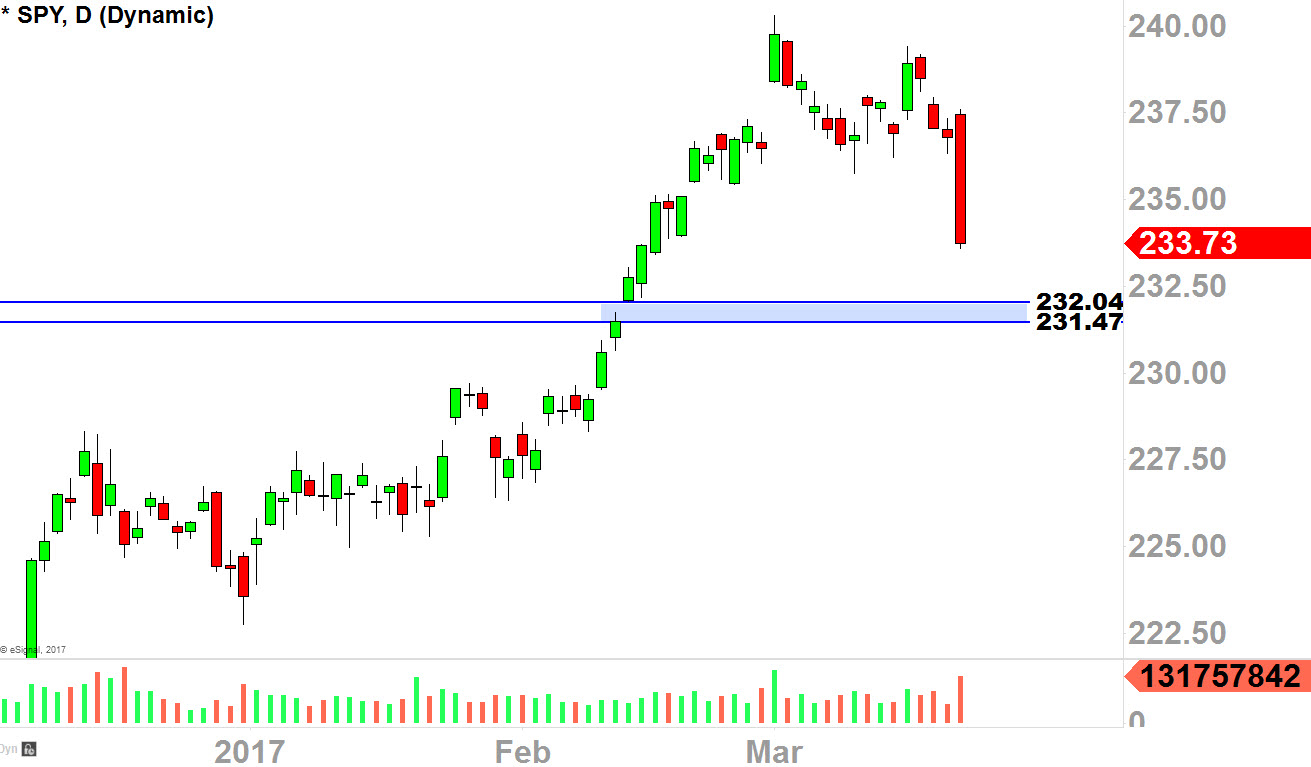
If we do get back up we may retest 236.50ish, but if we continue lower, next level of support is the gap area.
Gap Area
Buyers may be eyeing on that 232-231ish gap-fill area as next level of support.
This is the support level I do think we may see some significance dip buyers coming in.
Fibs
When technicals coincide/overlap with each other, I always pay attention.
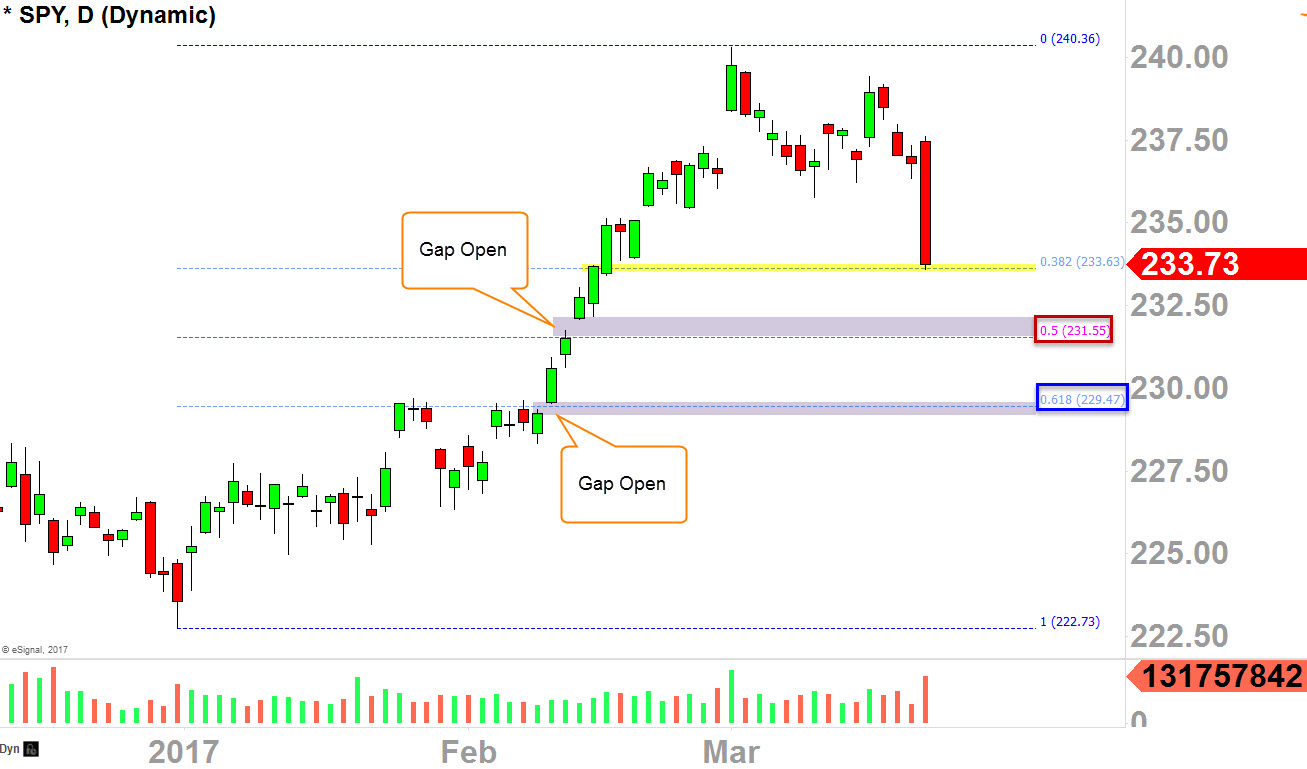
First, we can see that 38.2% level is exactly where we stopped selling today, so that would be the level to watch tomorrow at 233.70ish.
Also, 50% fib retracement level is coinciding with first "Gap Open" area, while 61.8% retracement level is also coinciding with second "Gap Open" area.
These are the levels I will be preparing to buy the dip once again on SPY (NYSE:SPY).
I think the worst case scenario for this pullback is 230ish, between 231-230, I think we will see much buyers show up.
2013 VS 2017
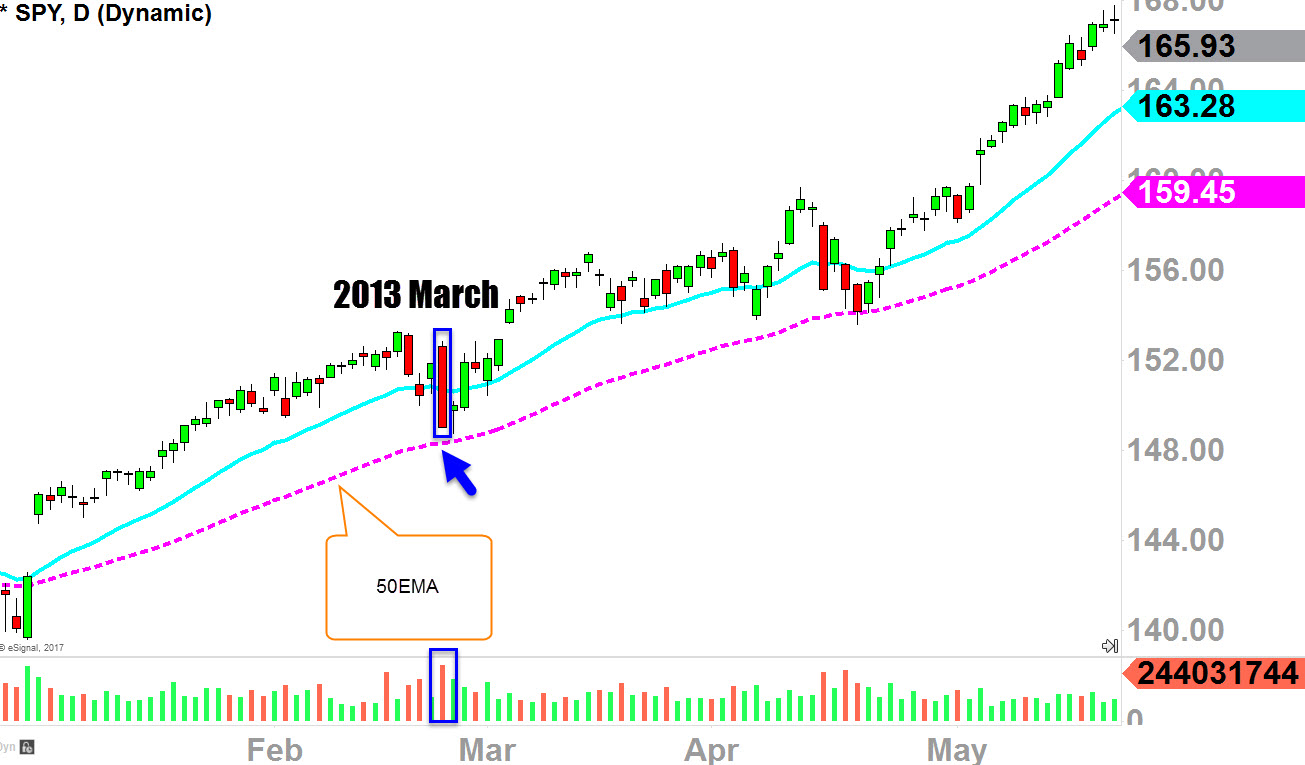
Past price-action comparison-analysis can be useful when attempting to understand market's psychological behavior as you can see from my last article on 1/31/2017 right before SPY moved 6% to the upside.
Here, today, we have very similar action to "2013 March," where the price broke below the 20EMA but found support at "50EMA" vicinity.
I think, in the next several days, if we do see a bounce here near the "50EMA," its definitely a level to pay attention to for the next big support.
Final Thoughts
When you see a pullback like today, within an intermediate-term uptrend, rather than panicking, I would look for opportunities.
That's exactly what I did today as I went through my Watch List and found setups that I could buy the dip on this weakness.
As of today, I am not sure exactly when/where we are going to see a bounce, but as I have depicted potential levels on this post, I think you can able to use those levels for your reference point as I will be watching the levels closely this week.
As of today, I am calmly holding all of my long positions including Intel Corporation (NASDAQ:INTC), Citigroup Inc (NYSE:C), iShares Russell 2000 (NYSE:IWM)
