Overbought Signal
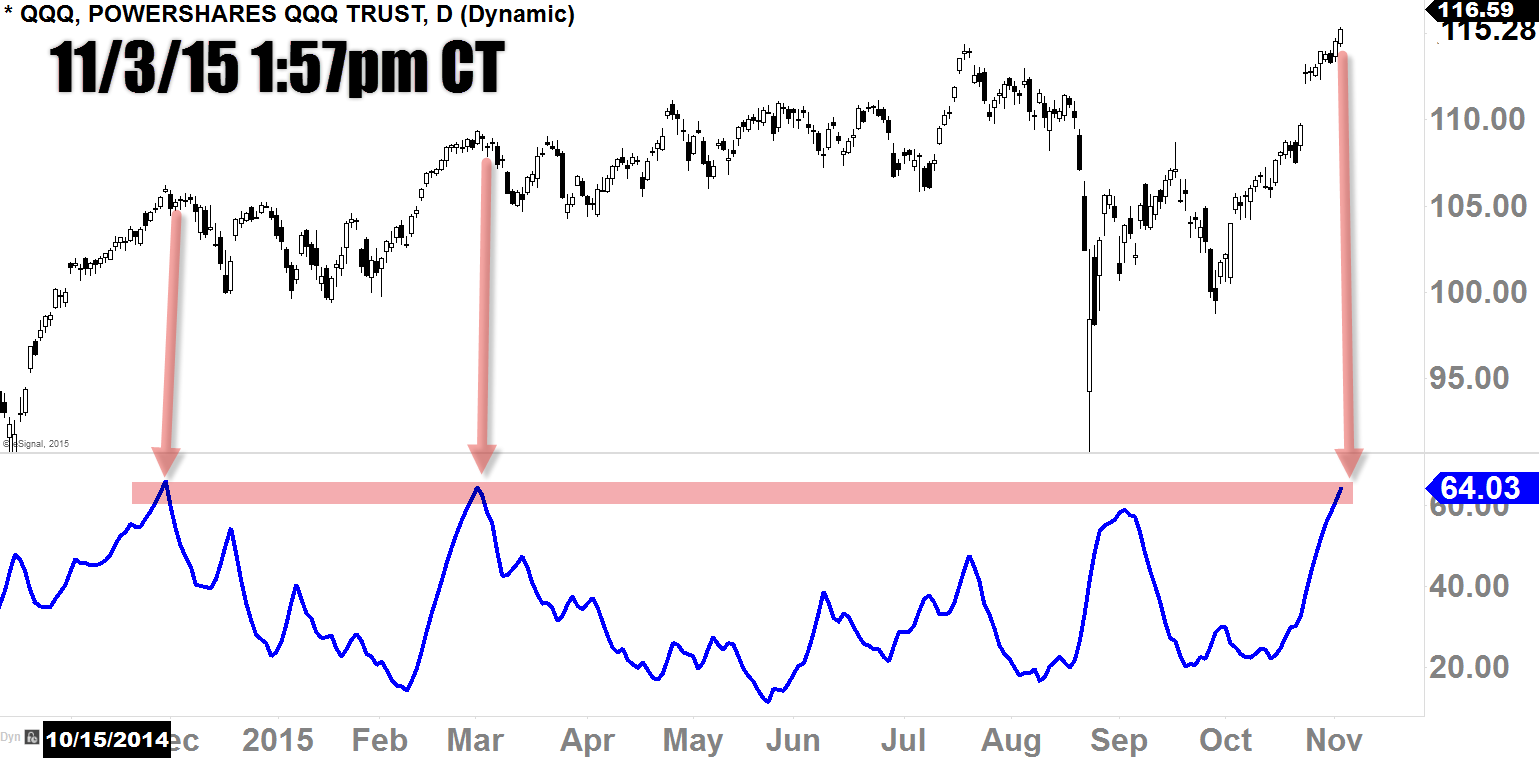
Since early last week, in our analysis, we've realized the buyers are starting to get tired in the minor-term as you can see in the chart below (screened on November 3rd 1:57pm).
This was when the Q's (PowerShares QQQ Trust Series 1 (O:QQQ)) were making it's new highs after a huge gap-up on October 23rd.
Though, everything looked bullish, ADX was signaling that the bulls are getting ready for a rest, which, at this point, we were expecting a minor-term pullback, and that SPDR S&P 500 (N:SPY) would also follow.
- This signal predicates upon minor-term sentiment, and not to be confused with major decline signals
Support Levels
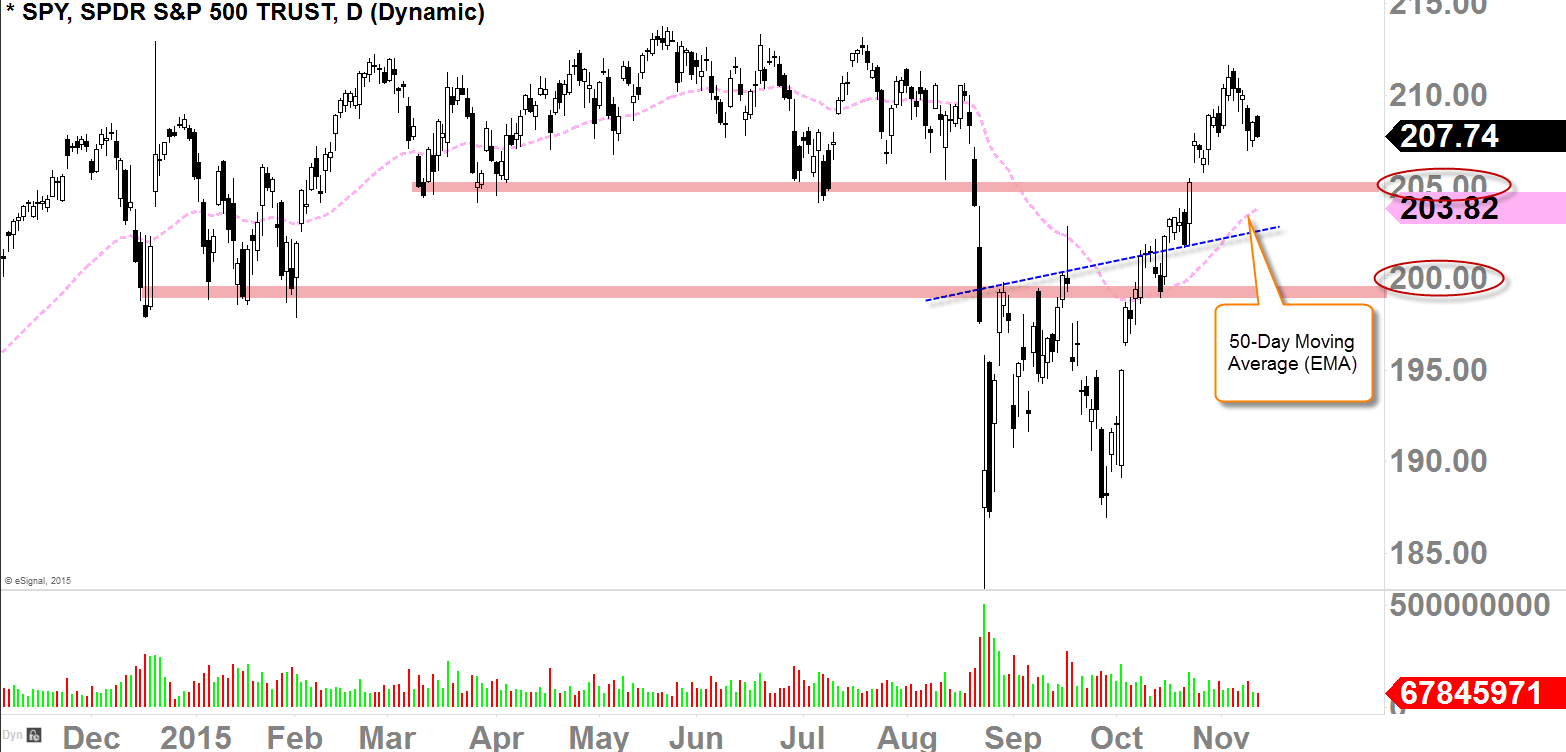
If we see further decline on the SPY, $205 is going to be next support to watch as it has been acting as strong support during March and April, and July of this year as you can see my annotation with red-highlight in the chart below.
If we lose this level to the downside, 50-day Moving Average (EMA) is currently residing at $203.82 which could act as a strong support as well because it has been a strong support on October 14th, and acted as strong resistance on September 17th, which makes this Moving Average a candidate for a strong pivot (I personally think if the price gets to this level, we probably going to see buyers at this level).
If we lose both of those levels to the downside, $197-$200 is the next support-level to watch, which I would call this level as a "must hold" level for the intermediate-term uptrend to continue.
- If all fails, $195 (gap fill from October 5th) could be the last resort for the buyers as the gap-fill often becomes support

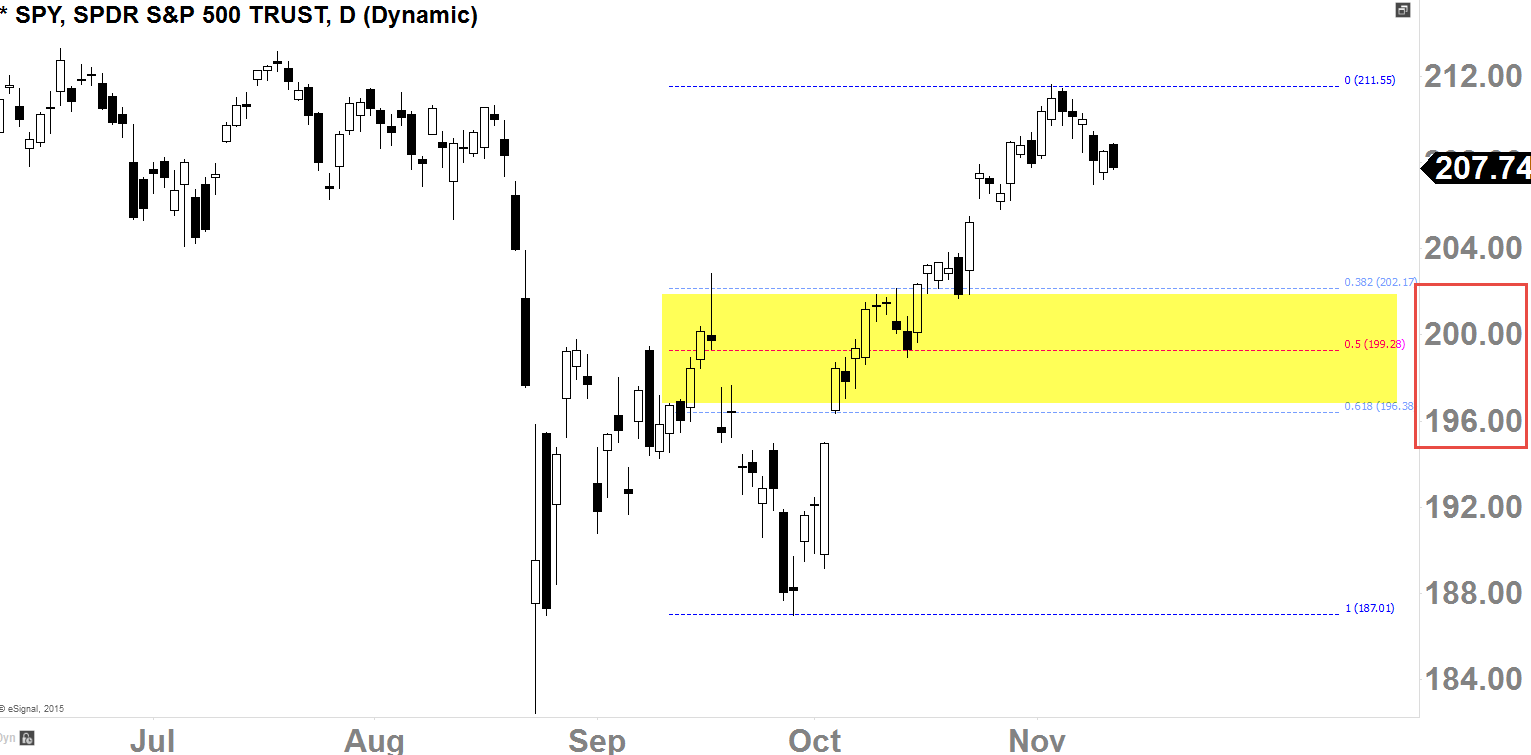
Below chart demonstrates the Fibonacci Retracement tool which forecast potential level of supports.
Also Fib. Retracement tool is very useful when trying define next "HIGHER LOW" vicinity for the intermediate-term uptrend development, which, in this case, is $203-$196ish level.
Currently, we can say that we do not have well-defined uptrend in the intermediate-term because we do not have that intermediate-term "HIGHER LOW".
Fib. Retracement suggests any of the levels highlighted is a potential level for that intermediate-term "HIGHER LOW" for the cultivation of the intermediate-term uptrend.
- $202.17-level for 38.2% retracement, $119.28-level for 50% retracement, and lastly $196.38-level for 61.8% retracement


