Get 40% Off
👀 👁 🧿 All eyes on Biogen, up +4,56% after posting earnings. Our AI picked it in March 2024.
Which stocks will surge next?
Unlock AI-picked Stocks

SPX Takes A Turns For The Worse

Published 12/11/2018, 05:39 AM
Updated 07/09/2023, 06:31 AM

The S&P 500 fell to an intraday low of 2583 yesterday, bringing its total decline to 12.1% from the top at 2941 in September. In Wall Street’s dictionary, a pullback of more than 10% is officially a correction and many are already worried about the big bear market ahead. On the other hand, it was only a month ago when the benchmark index touched 2815 and everyone was expecting a new all-time high soon.

Trade, Brexit and the slowing global growth are among the usual suspects the media uses to explain the current plunge. But all three were present a month ago as well and the market didn’t seem so worried about it then. What happened?

Our answer is that market psychology simply took a turn for the worse. The good news is there was an Elliott Wave warning on November 12th, when the S&P 500 was still looking healthy at 2780.
Elliott Wave analysis predicts SPX decline
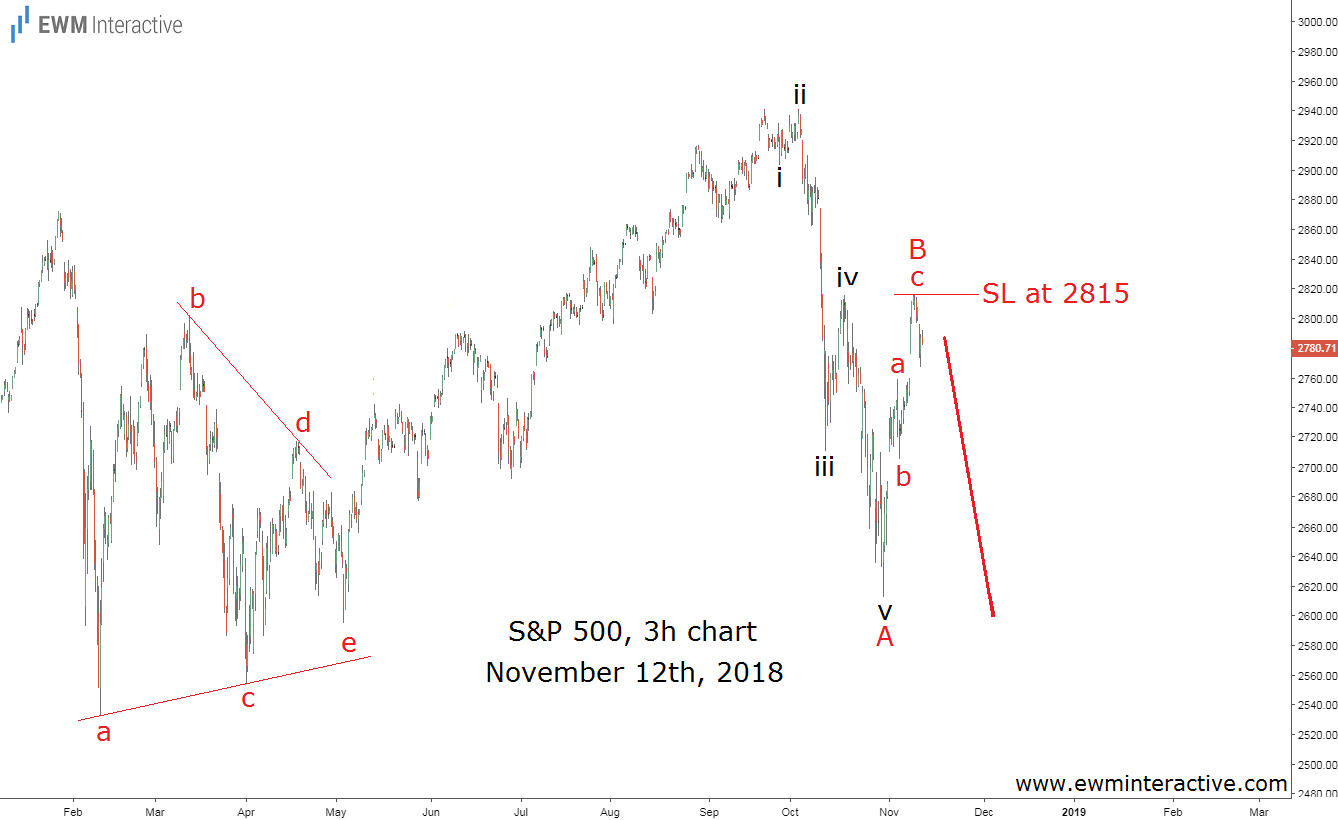
The 3h chart of the SPX revealed a triangle correction, labeled a-b-c-d-e. Triangles precede the final wave of the larger sequence. In this case, the bulls managed to lift the index to 2941 before running out of momentum. When that happened, a five-wave impulse, labeled i-ii-iii-iv-v, caused a selloff to as low as 2603.

Impulses indicate the direction in which the larger move is going. The three-wave recovery to 2815 completed the 5-3 wave cycle, which meant more weakness can be expected. A week later, the SPX fell to 2632:
SPX index Fell as Expected
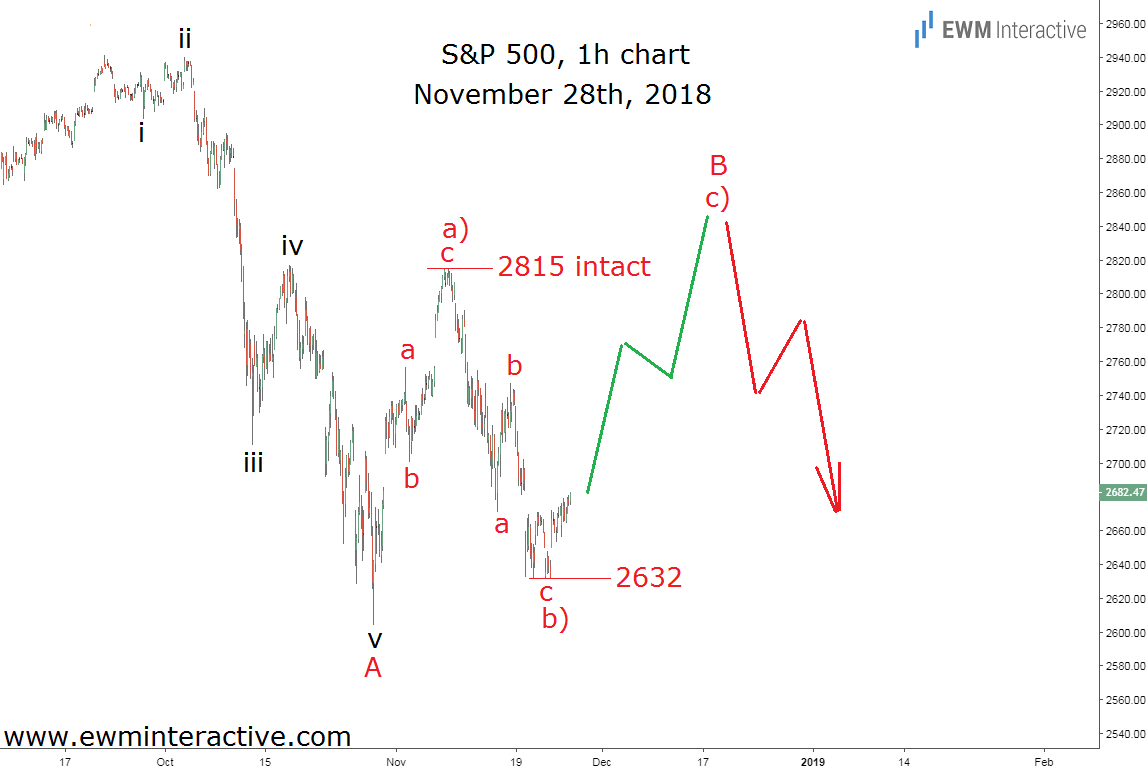
The decline from 2815 to 2632 looked like nothing more than another three-wave structure. This made us think that wave B was likely still in progress and higher level can be expected in wave c) before the downtrend resumes. No news was taken into account. The news is usually good at the top and bad at the bottom, so it often pays to simply ignore it. The updated chart below shows the S&P 500 as of yesterday’s close.
SPX tumbles as predicted by Elliott Wave principle

3rd party Ad. Not an offer or recommendation by Investing.com. See disclosure here or remove ads .

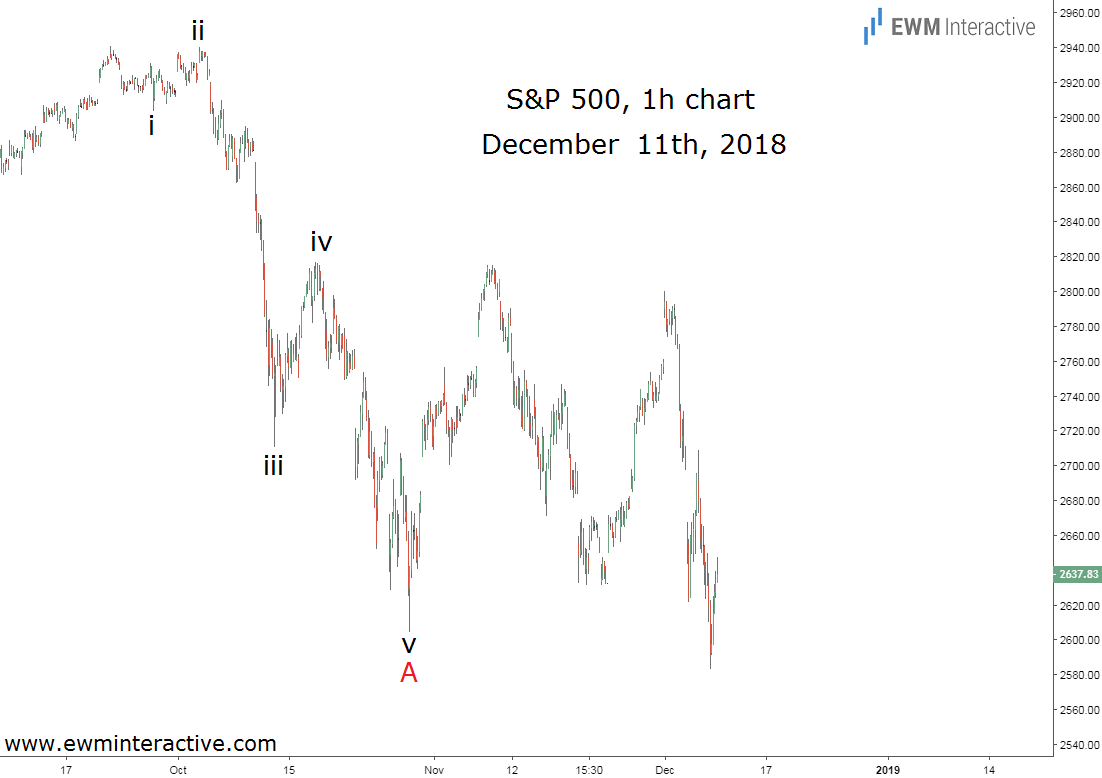
The SPX did not even manage to exceed 2815. The bulls were even weaker than we thought and 2800 turned out to be the best they could achieve. Soon the market entered into sell-now-ask-questions-later mode and the next 220 points went into the bears’ scorecard. The S&P 500 has returned a negative 1.34% year to date and it looks like 2018 will be a lost year for stock market investors.

As for 2019, we will keep counting on the Elliott Wave principle for guidance.

Original post

Latest comments

Risk Disclosure: Trading in financial instruments and/or cryptocurrencies involves high risks including the risk of losing some, or all, of your investment amount, and may not be suitable for all investors. Prices of cryptocurrencies are extremely volatile and may be affected by external factors such as financial, regulatory or political events. Trading on margin increases the financial risks.
Before deciding to trade in financial instrument or cryptocurrencies you should be fully informed of the risks and costs associated with trading the financial markets, carefully consider your investment objectives, level of experience, and risk appetite, and seek professional advice where needed.
Fusion Media would like to remind you that the data contained in this website is not necessarily real-time nor accurate. The data and prices on the website are not necessarily provided by any market or exchange, but may be provided by market makers, and so prices may not be accurate and may differ from the actual price at any given market, meaning prices are indicative and not appropriate for trading purposes. Fusion Media and any provider of the data contained in this website will not accept liability for any loss or damage as a result of your trading, or your reliance on the information contained within this website.
It is prohibited to use, store, reproduce, display, modify, transmit or distribute the data contained in this website without the explicit prior written permission of Fusion Media and/or the data provider. All intellectual property rights are reserved by the providers and/or the exchange providing the data contained in this website.
Fusion Media may be compensated by the advertisers that appear on the website, based on your interaction with the advertisements or advertisers.
© 2007-2024 - Fusion Media Limited. All Rights Reserved.