- SPX Monitoring purposes; Sold SPX 3/28/19 & 2815.44= gain .61%; Long 2798.36 & 3/25/19.
- Monitoring purposes Gold: Long GDX on 1/29/19 at 21.96.
- Long-Term Trend SPX monitor purposes; Long SPX on 10-19-18 at 2767.78
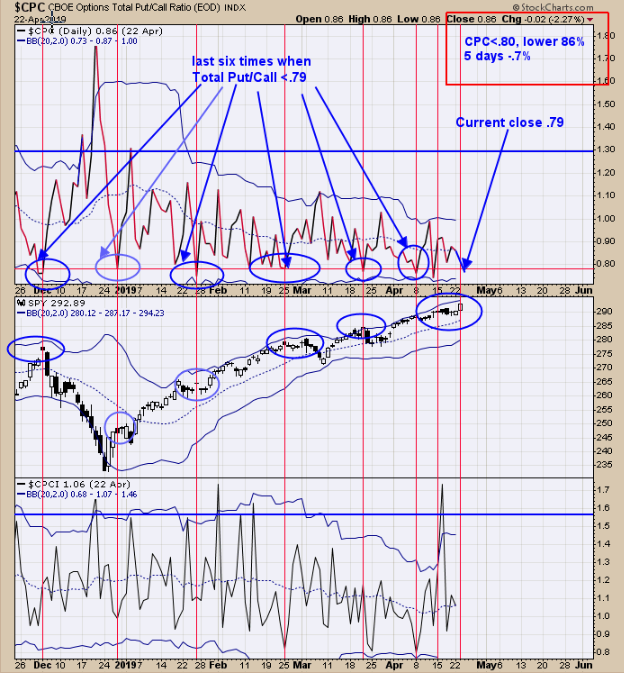
Not expecting a run away market here. SPX tested last September high today. Above is the “Total Put/Call ratio” (CPC) which closed today at .79. We have marked the previous times with red vertical lines when CPC reached .79. In all cases the market either declined or flipped sideways. April is usually an up month in pre-election years, so market may back and fill into next week. When the uptrend does top out the first area of support comes in the gap level between March and April near 2850 range. If the April gap is tested on higher volume than market may head to next support which is the 2800 level which is the November, December 2018 highs. Join us on twitter. @OrdOracle Ask for free 30 day trial.
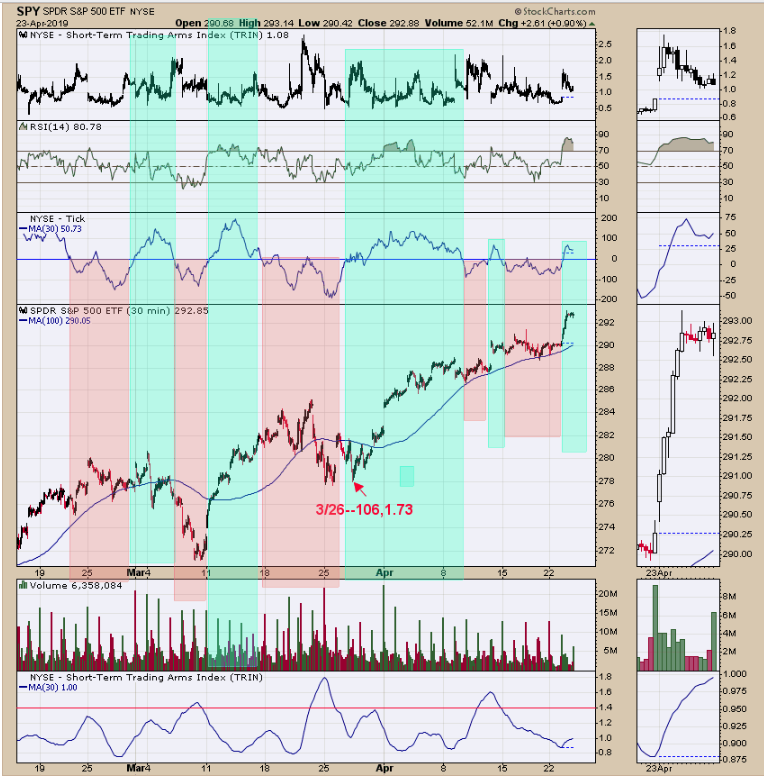
We have noticed that positive tick readings suggest an uptrend in the market and negative ticks suggests a downtrend. We have been working on several different tick methods and all show promise. Above is the 30 minute tick with an 30 period moving average just above the SPDR S&P 500 (NYSE:SPY) window. The ticks have been running negative up to today and have flipped positive. There are indicators suggests this move up is not the one to ride (could be wrong) but next time ticks fall below “0” and SPY fall below the moving average on the SPY a bearish sign could develop. Pre-election years April is usually an up month. If Seasonality holds true this April, then market could hold steady into next week. We have been posting this phase on the last several reports, “Fun statistics, is that with VIX under +16 and SPX up +10% last 3 months, April is higher 90% of the time averaging 2.75% gain.” Follow us on twitter. @OrdOracle
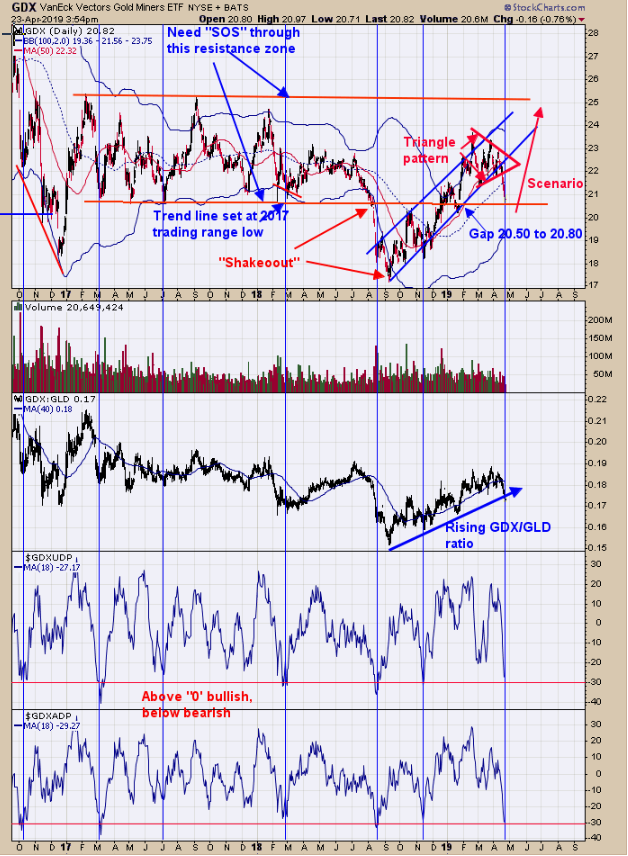
Above is the daily GDX chart going back 2 years and 7 months. Yesterday we said, “GDX trading range developed in 2017 between 21.00 to 25.00. GDX fell below the 21.00 level in late 2018 and then closed above it in early 2019 creating a bullish “Shakeout”. A “Shakeout” is a false break to the downside and they normally reverse and rally back to breakout to the upside which in this case would mean a break above the resistance level of 25.00. Form late January to mid April a “Triangle” pattern formed. Its common for the first breakout of a “Triangle” patterns to be a false break and that may have developed here. There is strong support near the bottom of the 2017 trading range near 21.00 and also there is an open gap that formed on January 25 in the 20.50 to 20.80 range which is also support. A cycle low is due from Mid April to early May and we are in that time zone now. Its common for “Triangle” patterns to form at the half way point of the move and if that is true this time around than an upside target near 28.00 range is possible.” Adding to that, the bottom window is Advance/Decline with an 18 period moving average indicator and next window up is the Up Down Volume with 18 period moving average indicator. When both indicators reach -30, GDX is near a low (designated with blue vertical lines) . GDX is near support and its common to overshoot support before it reverses higher which is common to happen on a Friday. Long GDX on 1/29/19 at 21.97. ord-oracle.com. New Book release "The Secret Science of Price and Volume" by Timothy Ord.


