- SPX Monitoring purposes; Short SPX on 8/30/17 at 2457.59.
- Monitoring purposes Gold: Neutral
- Long-term Trend monitor purposes: Neutral.
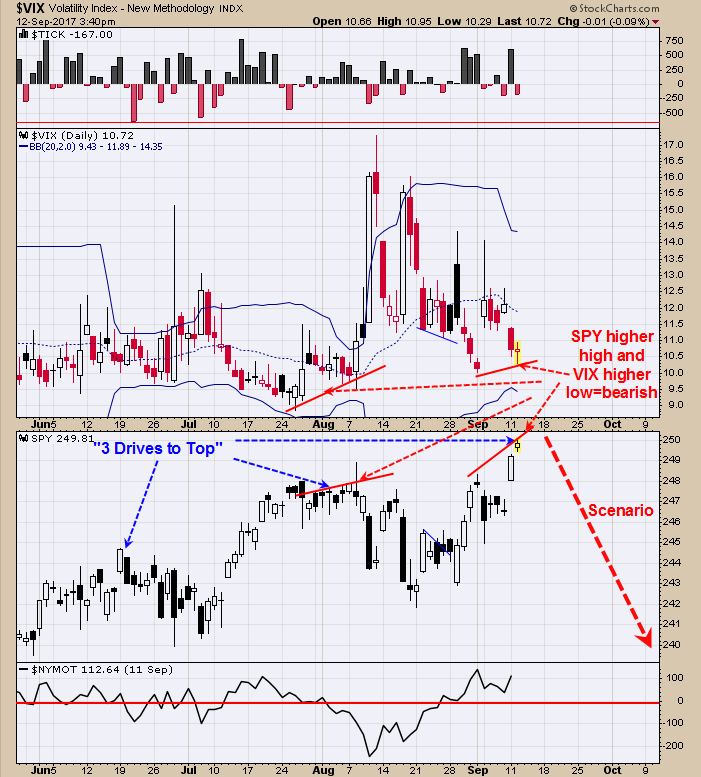
It is said the VIX leads the SPDR S&P 500 (NYSE:SPY) in the opposite direction. Today the SPY a higher high and the VIX made a higher low and a bearish divergence. This setup also occurred at the early August high where the SPY made a higher high and the VIX made a higher low. The pattern that appears in play is the “Three Drives to Top” and the “third Top” may be forming now. This is option expiration week which normally has a bullish bias and therefore market could hold up this week. An early clue that a decline has started would be for the McClellan Oscillator to close below “0”; the current reading is +125. We have a minimum downside target near 2400 on the SPX. Short SPX on 8/30/17 at 2457.59.
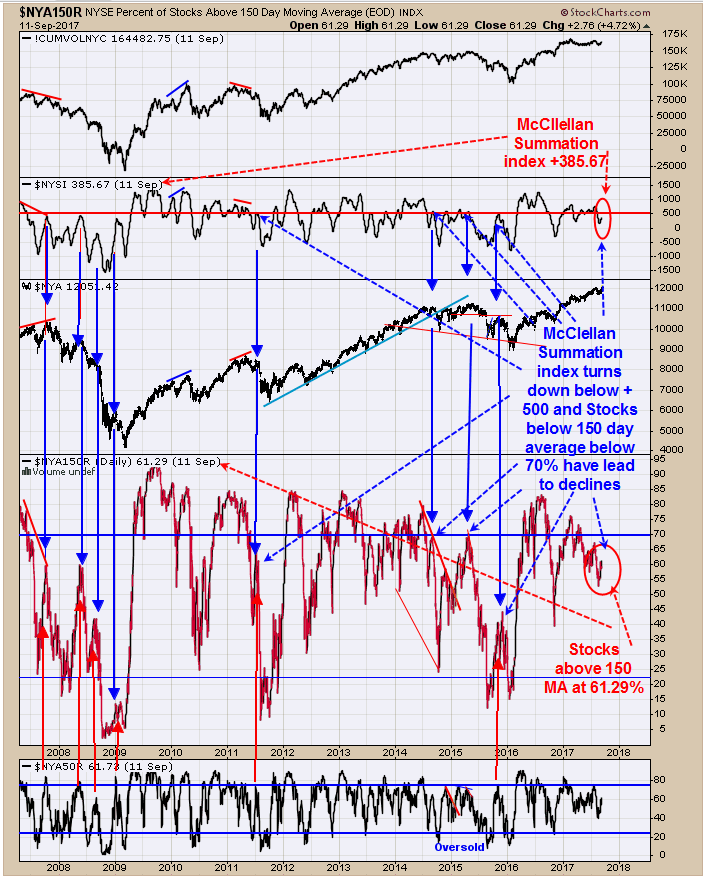
A bearish situation is present. A large decline can occur when the NYSE McClellan Summation index turns down before reaching +500 and the stocks above their 150-day moving average turns down before reaching 70%. The McClellan Summation index closed yesterday at +385.68 and still rising and the Stock above 150 MA stands at 61.29%. If both turn down from here, one could expect a worthwhile decline. The chart above shows the times when the McClellan Summation index turned down before reaching +500 and when the stocks above 150-day average turned down before reaching 70%. If the “Three Drives to Top” pattern plays out, the chart above would suggest the decline would break 2400 SPX minimum downside target. Short SPX on 8/30/17 at 2457.59.
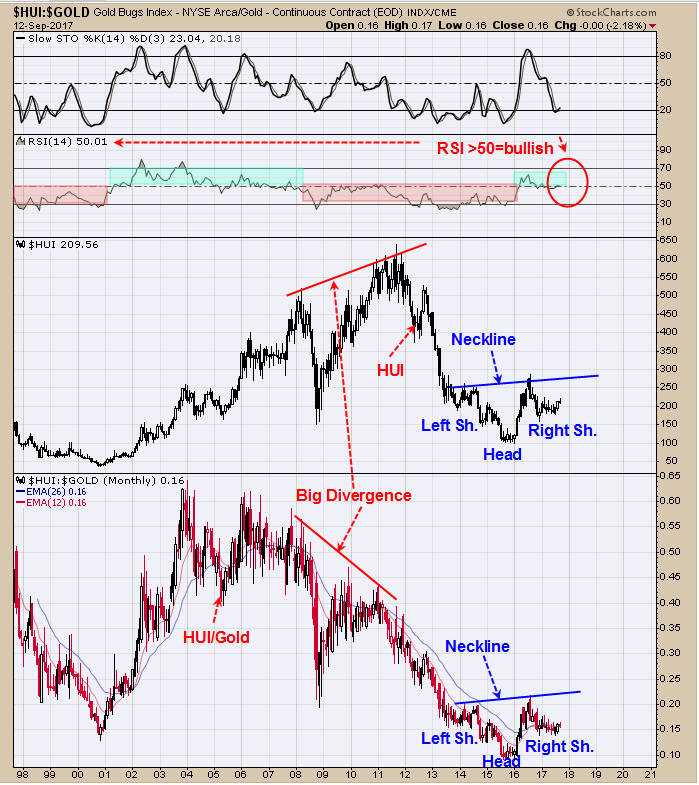
Above is the monthly HUI:Gold ratio (bottom window) with its monthly RSI. A bullish present is indicated when the Monthly RSI for the HUI:GOLD ratio stays above 50 (current reading is 50.01). The pattern forming on HUI:Gold ratio appears to be a Head and Shoulders bottom; a break through the Neckline will confirm this pattern. Normally the HUI/Gold ratio leads the way for HUI for a bullish outcome. It’s a little hard to see but HUI is testing the high of the Right Shoulder where HUI:GOLD is not, showing HUI is stronger than HUI:GOLD and a modestly bearish sign suggesting the current consolidation may not be complete. When HUI:GOLD ratio starts to outperform HUI than, the uptrend may be beginning. Next major cycle low is due later this year and could come as early as October to as late as January. Though the long term trend is bullish, the shorter timeframes are still mixed. Still neutral for now.”


