- SPX Monitoring purposes; Long SPX on 10/22/18 at 2755.88.
- Monitoring purposes Gold: sold 11/27/18 at 18.88=gain .075%; Long GDX at 18.72 on 8/17/18
- Long-term Trend SPX monitor purposes; Long SPX on 10-19-18 at 2767.78
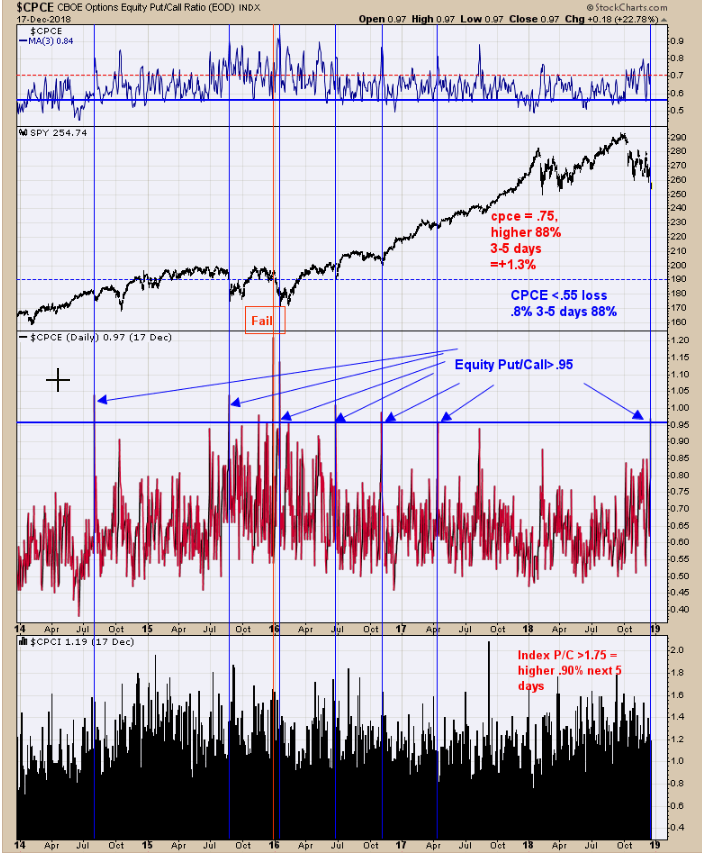
The chart above goes back 5 years and shows the times when Equity Put/Call (CPCE) reached >.95 (current reading .97). CPCE reached > .95 eight times and seven of those times where bottoms and most where major bottoms. A quite day tomorrow before the FOMC announcement at 2:00 eastern which could be catalysis for a rally. Follow us on twitter. @OrdOracle.
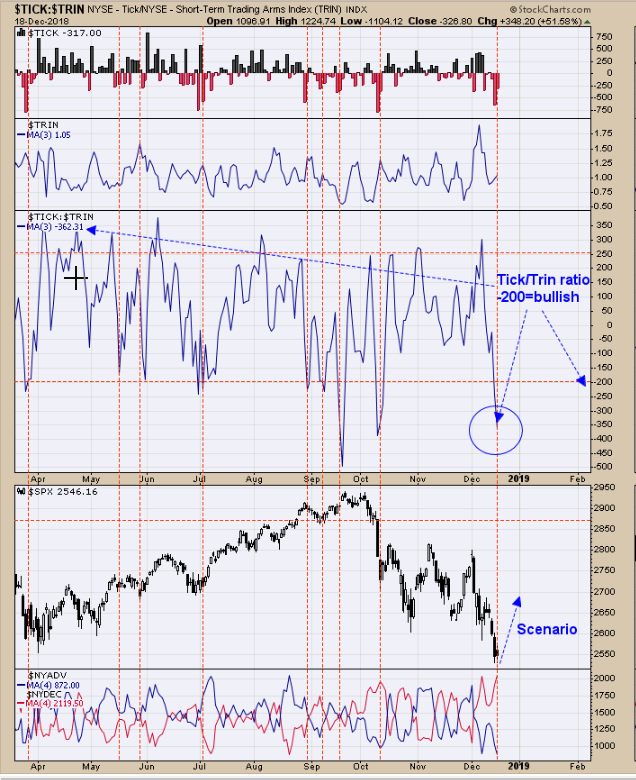
We have been posting this statement the last five weeks, “Since 1950 the change from October low through year-end average=10.7% gain (with no losses) during mid-term elections years (@theonedave). The 10.7% average from the October low would give a target near 289 on the SPDR S&P 500 (NYSE:SPY) (2890 SPX).” This could be the first failure. Having said that, turn your attention to the chart above which is the 3 day average of the Tick/Trin ratio. Since mid October low the “3 day average Tick/Trin ratio” has not generated a signal, until today. The signals in the past have worked out relative well. The current bullish signal goes well with the bullish Equity put/Call and Total put/call ratio that have been generated in the last couple of days. This is option expiration week and December expiration has a 75% probability of being higher. Also the month of December is higher 75% of the time. FOMC announcement is tomorrow which could be the catalysis for a rally. We did buy SPY “calls” today as it would seem odds are good for a rally from here. Follow us on twitter. @OrdOracle
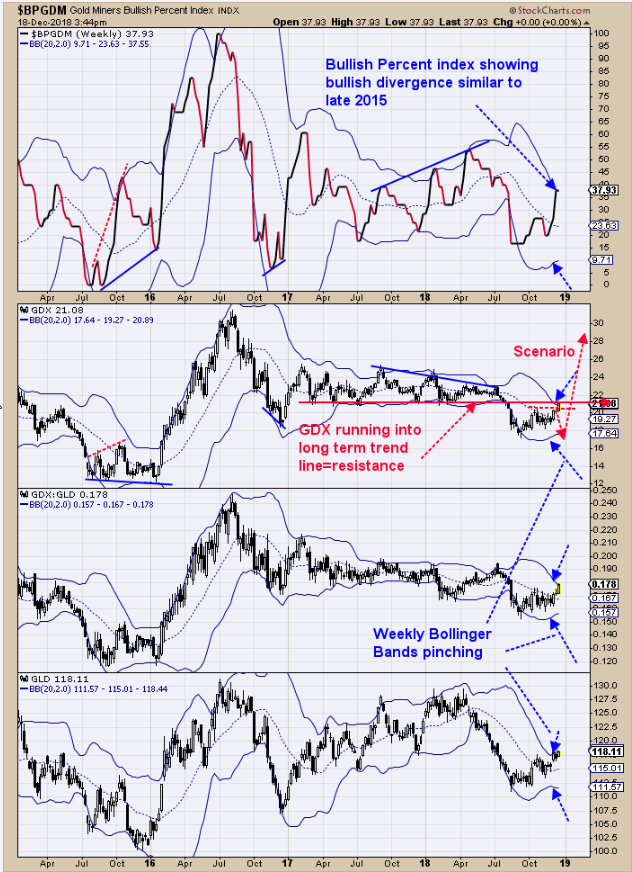
The top window is the Bullish percent index for the Gold Miners index which has been moving higher for several weeks and a bullish sign. GDX is running into the Trend line connecting the lows going back to early 2017, which is resistance. If GDX can get through this resistance than that would be a game changer and would suggests a bottom is in but we are not sure that will happen. There is a cycle low due in January or February but there is now evidence that the cycle low may come in the January 22 timeframe of 2019 which would imply there is a minor high do soon. The last COT report showed that Gold commercials moved to a 77K short position and above the 50K which is in the neutral to bearish category for them. We are watching carefully what this chart does next, either a bull run is starting or a short term top is near. Our thinking at the moment is still a pull back first before the real Bull Run begins. We sold our long GDX position (11/27/18) at 18.88 for a .075% gain; Long GDX at 18.72 on 8/17/18. We will wait for the next bullish setup. New Book release "The Secret Science of Price and Volume" by Timothy Ord.


