Get 40% Off
🚨 Volatile Markets? Find Hidden Gems for Serious OutperformanceFind Stocks Now

SPX, GDX And Gold Technicals: April 26, 2017

Published 04/26/2017, 11:33 AM
Updated 07/09/2023, 06:31 AM
  • SPX Monitoring purposes; Long SPX on 4/12/17 at 2344.93.
  • Monitoring purposes Gold: Sold GDX 4/18/17 at 24.27 near break even; Long GDX on 4/13/17 at 24.54.
  • Long-Term Trend monitor purposes: Neutral.
  • Volatility (top), SPDR S&P 500

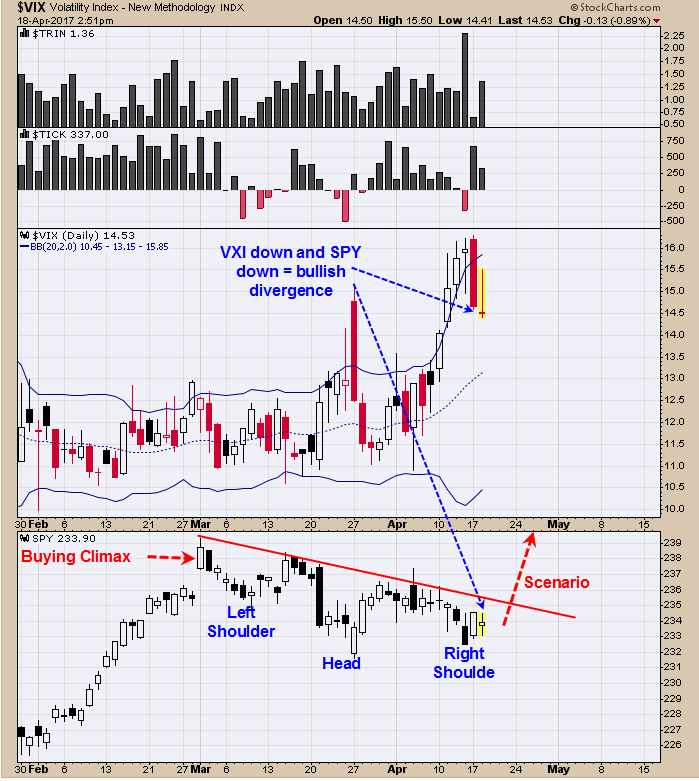
    This week is option expiration week which normally has a bullish bias. The chart above is the CBOE Volatility Index. The VIX normally trades opposite of the SPY. Today the VIX was down (showing less volatility) and the SPY was down. Its common for the VIX to lead the way (in the opposite direction) for the SPY and today’s down VIX suggests the SPY should be going up. A positive divergence is present for the VIX suggesting the rally in the SPY is not done. The pattern that appears to be forming is a bullish Head and Shoulders bottom. First up side resistance is near the March 1 high at 2400 range on the SPX. Long SPX on 4/13/17 at 2344.93.

    Equity Put/Call Ratio

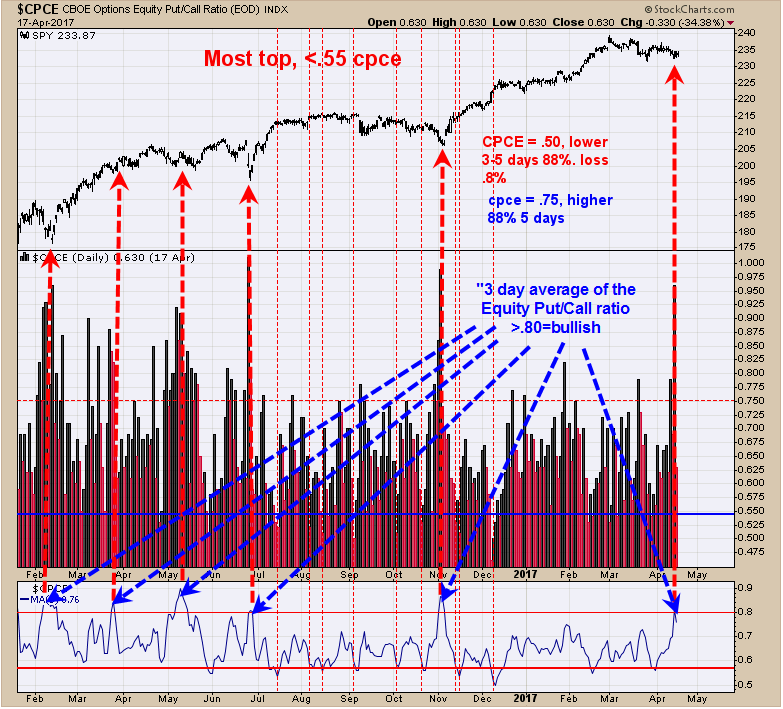
    Last Thursday the Equity Put/Call ratio closed at .98, readings of .75 and higher predict the market will be higher on average of 1.3% in the next five days 88% of the time. The bottom window is the three day average of the Equity put/call ratio and readings of .80 and higher send a stronger message the market will higher. This chart goes back one year and three months and in all cases where the three day average of the Equity put/call ratio reached .80 and higher the market was higher each time. In general, expecting market to move higher and test the March 1 high near the 2400 range on the SPX. SPX on 4/12/17 at 2344.93.

    GDX/GLD Ratio

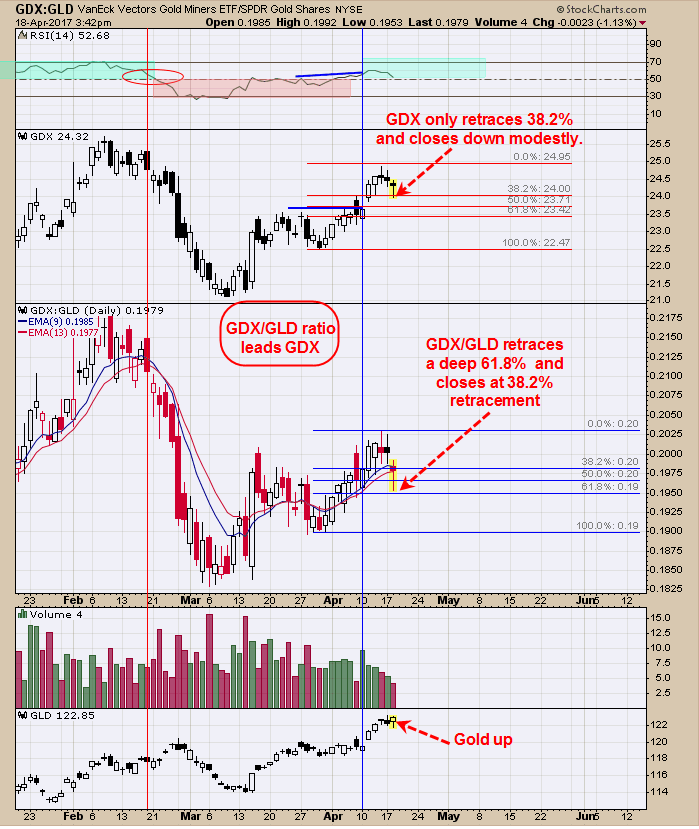
    It is said that the GDXGLD ratio leads the way for GDX. Today the GDX/GLD ratio retraced 61.8% of the move from the late March low and closed near the 38.2% level. GDX retraced 38.2% of the move from the late March low and closed just modestly down. Since GDX/GLD ratio is much weaker than GDX, it suggests weakness ahead for GDX. Though the RSI for the GDX/GLD ratio is still above 50 (but not by much) which is still bullish but has weaken today and any weakness tomorrow on GDX/GLD ratio will push the RSI below 50 and in bearish territory. The GDX/GLD ratio showing weakness ahead for GDX. Sold GDX at 24.27 for a modest loss; Long GDX on 4/13/17 at 24.54.

3rd party Ad. Not an offer or recommendation by Investing.com. See disclosure here or remove ads .

Latest comments

Risk Disclosure: Trading in financial instruments and/or cryptocurrencies involves high risks including the risk of losing some, or all, of your investment amount, and may not be suitable for all investors. Prices of cryptocurrencies are extremely volatile and may be affected by external factors such as financial, regulatory or political events. Trading on margin increases the financial risks.
Before deciding to trade in financial instrument or cryptocurrencies you should be fully informed of the risks and costs associated with trading the financial markets, carefully consider your investment objectives, level of experience, and risk appetite, and seek professional advice where needed.
Fusion Media would like to remind you that the data contained in this website is not necessarily real-time nor accurate. The data and prices on the website are not necessarily provided by any market or exchange, but may be provided by market makers, and so prices may not be accurate and may differ from the actual price at any given market, meaning prices are indicative and not appropriate for trading purposes. Fusion Media and any provider of the data contained in this website will not accept liability for any loss or damage as a result of your trading, or your reliance on the information contained within this website.
It is prohibited to use, store, reproduce, display, modify, transmit or distribute the data contained in this website without the explicit prior written permission of Fusion Media and/or the data provider. All intellectual property rights are reserved by the providers and/or the exchange providing the data contained in this website.
Fusion Media may be compensated by the advertisers that appear on the website, based on your interaction with the advertisements or advertisers.
© 2007-2024 - Fusion Media Limited. All Rights Reserved.