
Spectrum Brands Holdings (NYSE:SPB) Inc. SPB reported mixed first-quarter fiscal 2022, wherein the bottom line missed the Zacks Consensus Estimate, while sales beat the same. Strength in the pet segment and solid demand contributed to the quarterly results, while dismal margins stemming from cost inflation and price surge acted as deterrents.
We note that shares of SPB have gained 8.6% in a year against the industry's decline of 55.7%.
Q1 Highlights
The company reported an adjusted loss of 6 cents per share against adjusted earnings of 83 cents in the year-ago period due to dismal gross margin, lower operating income and elevated SG&A expenses. The figure also lagged the Zacks Consensus Estimate of earnings of 5 cents.
Spectrum Brands' net sales grew 2.9% year over year to $757.2 million and beat the Zacks Consensus Estimate of $750 million. Acquisition-related gains of $16.5 million aided the top line, while adverse foreign currency impacts of $7.3 million remained a drag. Excluding the adverse impacts of currency and sales from buyouts, organic net sales rose 1.6%. The pandemic-led disruptions and supply-chain headwinds hurt organic sales to some extent.
The gross profit decreased 13.3% year over year to $219.3 million, while the gross margin contracted 530 basis points (bps) year over year to 29% due to elevated freight and raw-material costs. These were somewhat offset by better productivity related to the Global Productivity Improvement Program.
SG&A expenses rose 5.7% to $203.5 million. As a percentage of sales, SG&A expenses expanded 70 bps to 26.9%.
The company reported an operating loss of $23.8 million against an operating income of $25.8 million in the year-ago quarter. The downside was mainly due to dismal margins stemming from a rise in distribution costs, higher marketing investment and product innovation.
Adjusted EBITDA from continuing operation plunged 53.4% to $49.3 million in the fiscal first quarter, driven by weak operating income. The adjusted EBITDA margin contracted 790 bps to 6.5%.
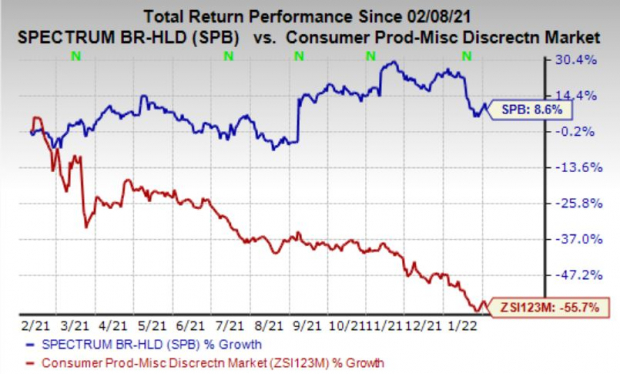 Image Source: Zacks Investment Research
Segmental Performance
Sales in the Home & Personal Care segment increased 0.3% to $379.7 million. This was mainly due to strength in the Latin America region, owing to robust holiday season sales and expanded distribution, partly offset by a decline in sales stemming from the lack of availability and supply-chain constraints. Excluding the adverse impacts of foreign currency, organic net sales for the segment increased 1.7%. The segment's adjusted EBITDA of $27.4 million advanced 46.2% due to higher freight and input costs as well as the rise in marketing and advertising investments, and product innovation, which somewhat offset better productivity.
The Global Pet Care segment's sales grew 9.7% year over year to $302.2 million, primarily driven by double-digit growth in aquatics and continued growth in the companion animals category. Excluding the unfavorable impacts of foreign currency and sales from acquisitions, organic sales rose 7.3%. The segment's adjusted EBITDA slumped 27.8% to $38.7 million due to higher freight and input costs as well as the rise in marketing and advertising investments, and product innovation, which somewhat offset improved productivity.
The Home & Garden segment's sales decreased 8.5% to $75.3 million primarily on dismal sales across all product categories as well as supply-chain issues. On the flip side, gains from the acquisition of Rejuvenate provided some cushion to the stock. Organic sales declined 17.9% year over year in the quarter under review. The segment's adjusted EBITDA was a loss of $7.3 million against earnings of $10.4 million in the prior-year quarter.
Other Financials
As of Jan 2, 2022, Spectrum Brands’ cash and cash equivalents were $205 million, with an outstanding debt of $2,994 million. Management repurchased shares worth $110 million in the quarter under review. It has roughly $116 million available under its $600-million cash flow revolver. It earlier entered a $150-million 10b5-1 share repurchase deal, out of which $125.9 million has been used as of Jan 2.
Guidance
Management retained the fiscal 2022 view. The company anticipates sales growth in the mid to high-single digits. Adjusted EBITDA is likely to rise in the low-single digits. Inflation is expected to be $310-$330 million, up from the earlier mentioned $240-$260 million. However, Spectrum Brands is undertaking pricing actions to overcome the hurdle.
Spectrum Brands Holdings Inc. Price, Consensus and EPS Surprise

Spectrum Brands Holdings Inc. price-consensus-eps-surprise-chart | Spectrum Brands Holdings Inc. Quote
Business Developments
SPB’s Home and Personal Care segment has entered a deal to acquire the home appliances and cookware categories of Tristar Products, Inc., which is likely to be completed in the next 90 days. The addition of Tristar Business to the Home and Personal Care segment will likely contribute to margins in the global appliance space.
The Tristar Business comes with a content creation studio, incredible DRTV capabilities and the direct-to-consumer distribution business. Post the complete integration of Tristar and the Home and Personal Care segment; the combined business will generate synergies of $20-30 million. Tristar’s direct-to-consumer capabilities and innovation pipeline are likely to aid the segment’s top line. Spectrum Brands intends to form a separate company, which will be a merger of Tristar, and the Home and Personal Care segment, in late 2022.
The Zacks Rank #5 (Strong Buy) company also noted that the divestment of its Hardware and Home Improvement segment to Assa Abloy (OTC:ASAZY) is likely to be concluded this year.
Stocks to Consider
Some better-ranked stocks from the Consumer Discretionary sector are Delta Apparel (NYSE:DLA) DLA, Oxford Industries (NYSE:OXM) OXM and World Wrestling (NYSE:WWE) Entertainment WWE.
Oxford Industries currently sports a Zacks Rank #1 (Strong Buy). The company has a trailing four-quarter earnings surprise of 96.7%, on average. Shares of OXM have gained 15.5% in the past year. You can see the complete list of today’s Zacks #1 Rank stocks here.
The Zacks Consensus Estimate for Oxford Industries’ current financial year’s sales and earnings suggests growth of 51.9% and 523.8%, respectively, from the year-ago period's reported numbers.
World Wrestling presently carries a Zacks Rank #1. The company has a trailing four-quarter earnings surprise of 75.5%, on average. Shares of WWE have rallied 10% in a year.
The Zacks Consensus Estimate for World Wrestling current financial-year sales and earnings suggests growth of 16.5% and 11.3% from the year-ago period’s reported numbers, respectively.
Delta Apparel currently carries a Zacks Rank #2 (Buy). The company has a trailing four-quarter earnings surprise of 95.5% on average. The DLA stock has gained 30.3% in the past year.
The Zacks Consensus Estimate for Delta Apparel's current financial year’s sales and earnings per share suggests growth of 11.9% and 10.1%, respectively, from the year-ago period's reported numbers.
Just Released: Zacks Top 10 Stocks for 2022
In addition to the investment ideas discussed above, would you like to know about our 10 top buy-and-hold tickers for the entirety of 2022?
Last year's 2021 Zacks Top 10 Stocks portfolio returned gains as high as +147.7%. Now a brand-new portfolio has been handpicked from over 4,000 companies covered by the Zacks Rank. Don’t miss your chance to get in on these long-term buys
Access Zacks Top 10 Stocks for 2022 today >>Want the latest recommendations from Zacks Investment Research? Today, you can download 7 Best Stocks for the Next 30 Days. Click to get this free report
World Wrestling Entertainment, Inc. (WWE): Free Stock Analysis Report
Spectrum Brands Holdings Inc. (SPB): Free Stock Analysis Report
Oxford Industries, Inc. (OXM): Free Stock Analysis Report
Delta Apparel, Inc. (DLA): Free Stock Analysis Report
To read this article on Zacks.com click here.
Zacks Investment Research