Get 40% Off
⚠ Earnings Alert! Which stocks are poised to surge?
See the stocks on our ProPicks radar. These strategies gained 19.7% year-to-date.
Unlock full list

S&P 500 Update: Is Pullback to Around 3800 Complete?

Published 12/22/2022, 03:01 PM

Over the last several weeks, we have been expecting the S&P 500 (SPX)  to find a bottom around $3800+/-100 according to the Elliott Wave Principle (EWP). Although we did not get every twist and turn correctly, which is an impossible task, one can browse through each article's link to the previous article to see what we were looking for the week prior. For example, last week, see here, we found:

"… we can narrow down the ideal target zone for all of the anticipated black W-b. From last week's "$3730-3870" to ideally $3840-3860, assuming the market will follow the ideal Fibonacci-based impulse pattern as shown by the green and grey target zones in Figure 1. Once more price data becomes available, we can narrow this target zone even further."

Fast-forward to today, and the index is currently trading at $3765. Thus my primary expectation for a continued move lower was validated. However, the SPX decided not to follow an ideal Fibonacci-based impulse pattern but to extend the waves. Are, as D. Rumsled would say, "a known unknown." Albeit the index is only 1.9% below the W-5 target zone of this perfect pattern, we must thus adjust and narrow it down a little bit more. See Figure 1 below.

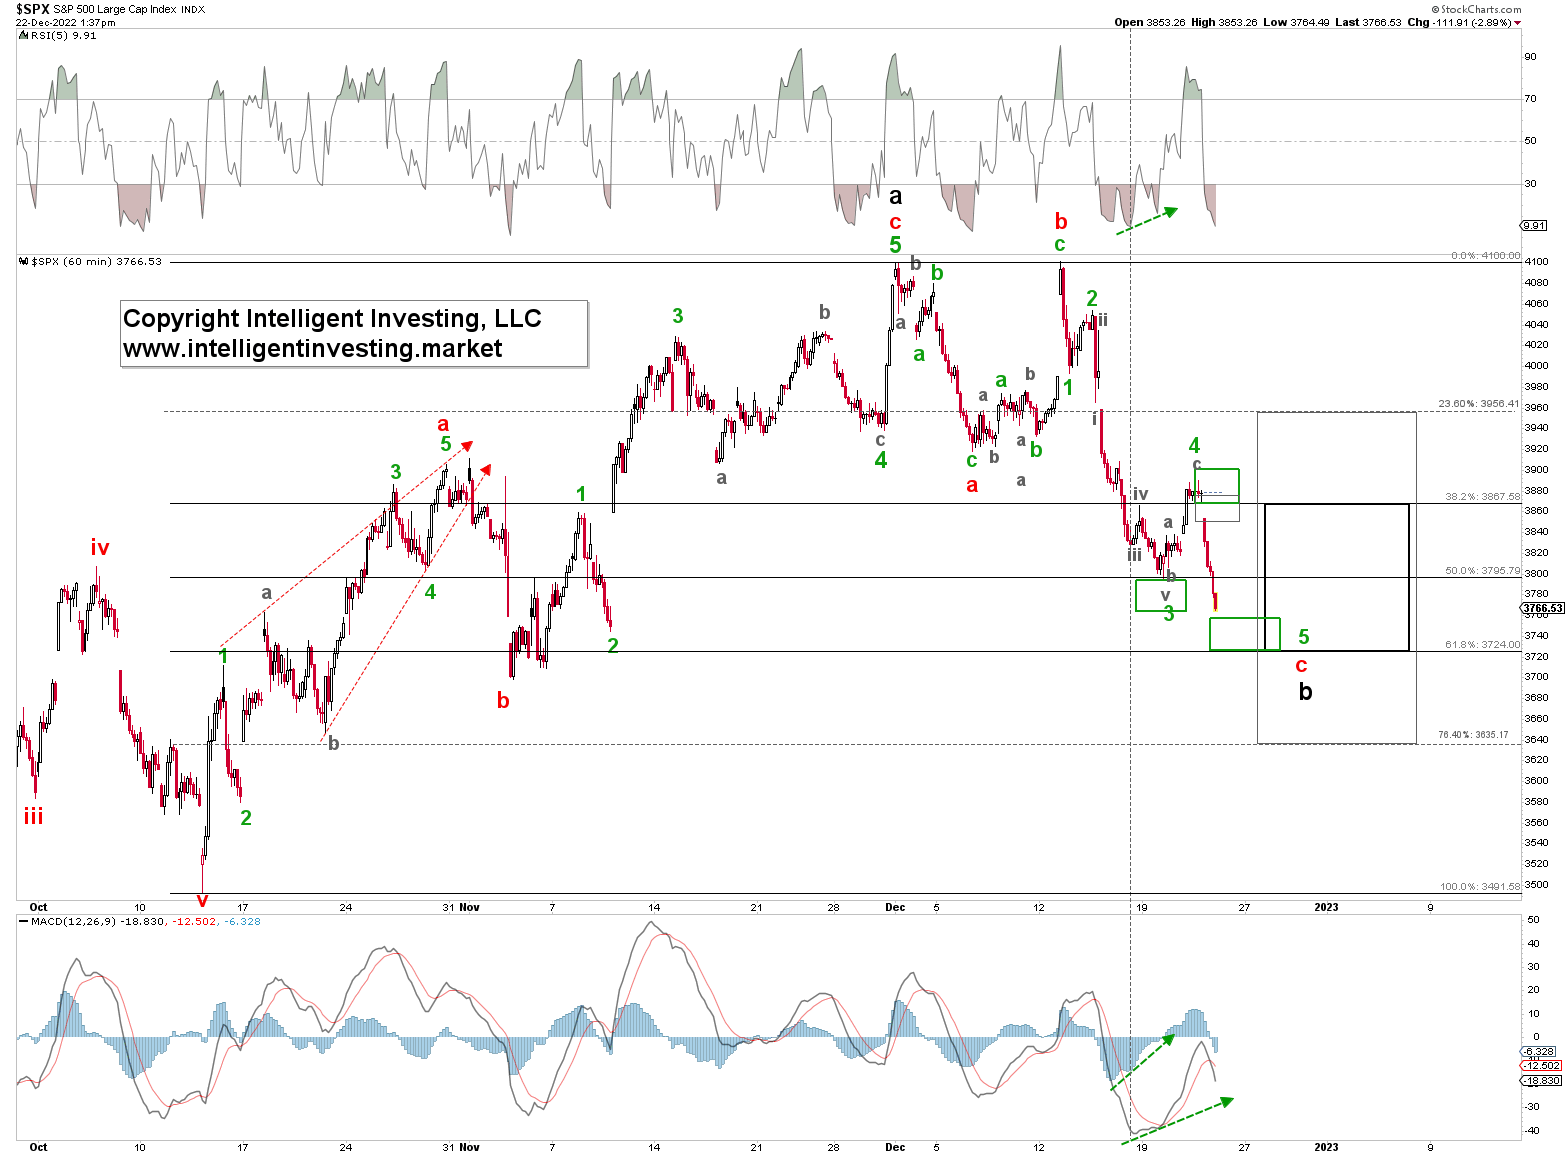
In the hourly chart above, we were already tracking the five sub-waves of the red W-c of black W-b last week. Why five waves? Because of the C-wave of a flat correction. The internal structure of a flat is a-b-c which in turn is a 3-3-5 pattern. Here green W-3 bottomed at $3795, yesterday's high was green W-4, and now green W-5 is underway with an ideal target zone of $3725-3755. Today's low, so far, is $3764.

Thus, as said two weeks ago:

"Once the $3800+/-70 zone is reached, …, we must entertain the notion all of black W-b has already bottomed out. The index will have to move below $3635 (the 76.40% retrace of the October 13 - December 1 rally), with the first warning below $3725, to start to suggest there will not be a more significant C-wave rally to $4300+." In addition, last week, we "shifted the timing of the low to preferably mid next week."

So far, so good. Besides, the famous Santa Rally is the last five trading days in December and the first two trading days in the following January. With the US stock markets closed on 12/26 and 01/02 in observance of Christmas and New Year, the window of opportunity for a Santa Rally will officially open tomorrow and end on January 4. When combining these facts with the EWP count, we have been tracking over the last few weeks; it is prudent to conclude that a sustained bottom could be close.

Latest comments

In previous analysis, you discussed the possibility of a large rally to mid 4k's on the horizon.  Do you still see this as probable?  Maybe a better way of asking is....Do you see it as more probable to test Oct lows or break Dec highs in the coming couple of months.   Or is there no way to asses that probability at this time?
C-wave rally to $4300+/-100 from here on out remains my preferred view as imho the W-a topped and W-b bottomed yesterday.
Thanks for the reply, I enjoy your analysis.
 Hi David, thank you, and you are welcome! I should have stated that in my article, but I thought it was clear that my primary expectation is for this rally to unfold. But I see now I could have added a last line saying that. However, I have had this primary expectation for many weeks, and the market has yet to disproof it. Happy Holidays!
Will the Christmas rally happen ?
Yep, it always does
'Sustained bottom' if you look at 95% of major bank projections for 2023. They are saying the S&P will only bottom in Q1 or Q2 next year and will bottom at anywhere between 2,900 -> 3,200 depending on how deep recession is implied / any black swan events in 2023 (Russia / China / Fed Debt / EU Recession etc). Most then agree of a rally in the 2nd half of the year with the S&P finishing 2023 more or less where we are now (circa 3,800 - 4,100). Obviously these are just guestimates but almost all agree that we will only hit a bottom in the first half of 2023 before a rebound (you might get a Santa Rally to bring us to 4,000 or 4,100 ceiling as traders buy the dip. But then can see a pull back in January or early Feb which continues into Q1 reporting season when a lot of values will have to be reset ...)
Lol 95%? Name more then one bank that says that?
 One bank?? JP Morgan, BoA, Citi, UBS, Goldman Sachs, Barclays, Morgan Stanley, Credit Suisse and RBC are ALLLL saying the market will only hit bottom in Q1 or Q2 of next year. The estimates for S&P year end in 2023 are: Barclays (3,625), Morgan (3,900), Godman Sachs (4,000), HSBC (4,000), BoA (4,000), Credit Suisse (4,025)....aww when you are shown up to be wrong ;) must be embarrassing when you are a constant Bull yet you do not have a clue ;)
 Plus the 2 outliers on the high side are Wells Fargo and Deutsche Bank who see a 4,300 - 4,500 year end by 2023. But both said only if very soft landing and see range in line with others if there is a slight dip or soft recession. so Lol is right ;) Next time do your reseach before you talk ;)
Should be called a new years rally then
Zoom out
Excellent, thank you! Black W-c of B may start.
You are welcome, and yes, the odds favor that scenario. Stop loss level for any long position are rather obvious now.
Thanks for sharing your analysis!
Thank you, and you are welcome.
isn't funny how people always change the goalposts of a 'santa rally' to fit there narrative even though recent data doesn't support the santa rally theory at all.
over the last decade the rally been on average pretty flat after all the the wall street narrative we get to tempt retail investors of a 'santa rally' then snice 99 January has been one of the worst months for returns as all the wall street rable come back to sell the rally
theDonger is still waiting you to support your statement with data. Look up the term “Validity”
you must be short, hence your defensiveness. It's his thesis you know, backed by his research and he is not 100% right no one is. You can read other analysts that have the opposite view also with their own thesis. the data is out there you choose which point makes more sense. at the end the market does not care.
Risk Disclosure: Trading in financial instruments and/or cryptocurrencies involves high risks including the risk of losing some, or all, of your investment amount, and may not be suitable for all investors. Prices of cryptocurrencies are extremely volatile and may be affected by external factors such as financial, regulatory or political events. Trading on margin increases the financial risks.
Before deciding to trade in financial instrument or cryptocurrencies you should be fully informed of the risks and costs associated with trading the financial markets, carefully consider your investment objectives, level of experience, and risk appetite, and seek professional advice where needed.
Fusion Media would like to remind you that the data contained in this website is not necessarily real-time nor accurate. The data and prices on the website are not necessarily provided by any market or exchange, but may be provided by market makers, and so prices may not be accurate and may differ from the actual price at any given market, meaning prices are indicative and not appropriate for trading purposes. Fusion Media and any provider of the data contained in this website will not accept liability for any loss or damage as a result of your trading, or your reliance on the information contained within this website.
It is prohibited to use, store, reproduce, display, modify, transmit or distribute the data contained in this website without the explicit prior written permission of Fusion Media and/or the data provider. All intellectual property rights are reserved by the providers and/or the exchange providing the data contained in this website.
Fusion Media may be compensated by the advertisers that appear on the website, based on your interaction with the advertisements or advertisers.
© 2007-2024 - Fusion Media Limited. All Rights Reserved.