Get 40% Off
⚠ Earnings Alert! Which stocks are poised to surge?
See the stocks on our ProPicks radar. These strategies gained 19.7% year-to-date.
Unlock full list

S&P, NASDAQ Follow Russell 2000 Lower On Confirmed Distribution

Published 12/18/2018, 12:09 AM
Updated 07/09/2023, 06:31 AM

Sellers stayed on for another day as yesterday it was the turn of the S&P and NASDAQ to follow the losses of the Russell 2000 from Friday. Volume picked up in confirmed distribution, suggesting there was substance behind yesterday's selling.

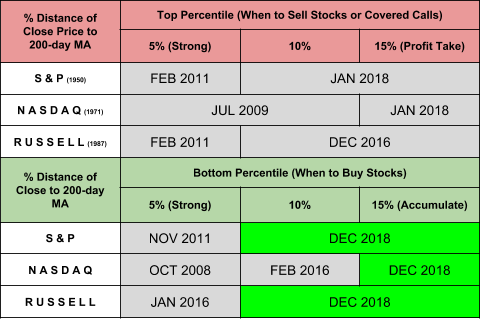
On the investment front, the S&P moved into the "10% zone" of historic price action (i.e. 90% of S&P action dating back to 1950 was better than what we are seeing now); it's another accumulate buy for those looking to build a long-term investment. The NASDAQ was only 0.4% from doing likewise—completing the history trip back to February 2016. After that, we are looking at 2008 and 2011 style corrections.

When to Buy/Sell

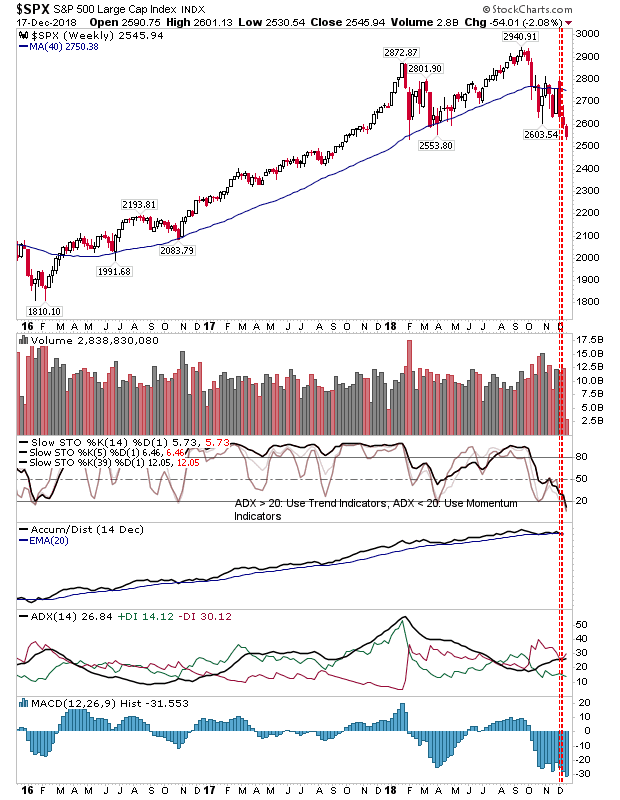
The S&P undercut the 'bullish hammer', negating the pattern. Looking at the weekly chart, the next support levels are down at 2,195 and 2,085. I would be surprised if the S&P got down there but you never know what may happen in the coming weeks or months.
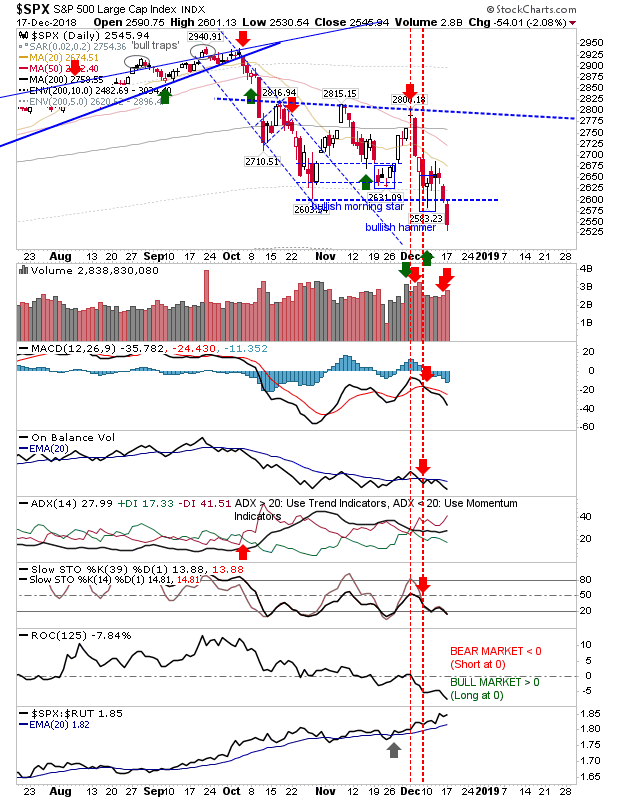
SPX Daily Chart
SPX Weekly Chart

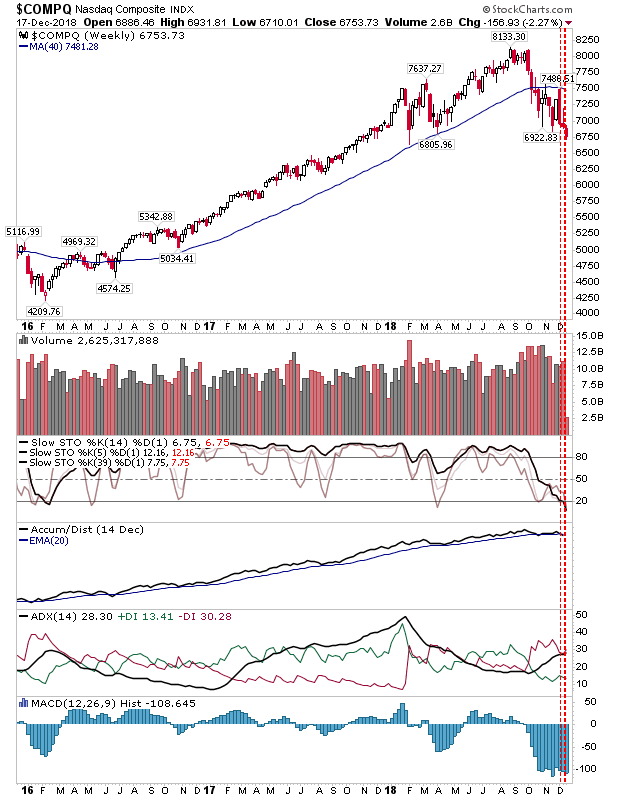
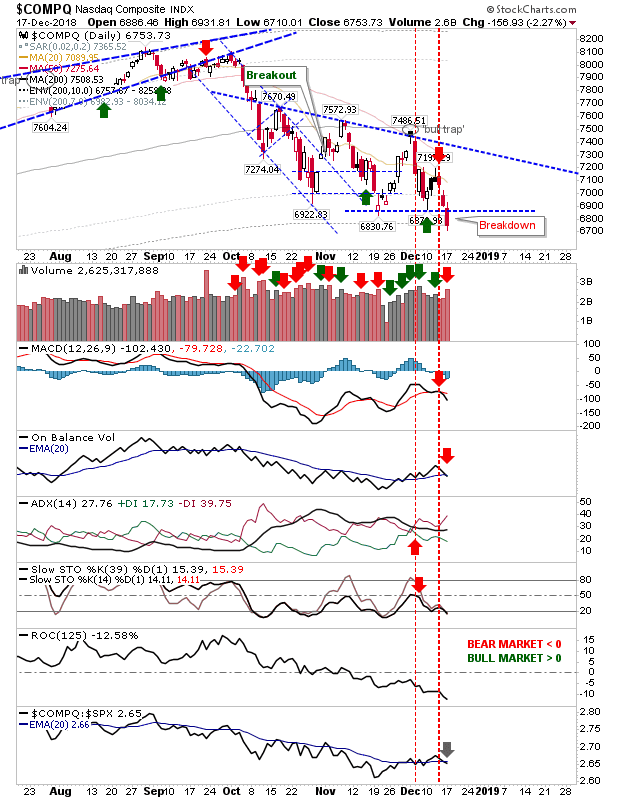
The NASDAQ is sitting in a similar position to the S&P; a confirmed breakdown on bearish net technicals. Like the S&P, nearest support is a long way away: 5,340 and 5,035, but first we'll be watching for a 'bull trap.'
COMPQ Daily Chart
COMPQ Weekly Chart

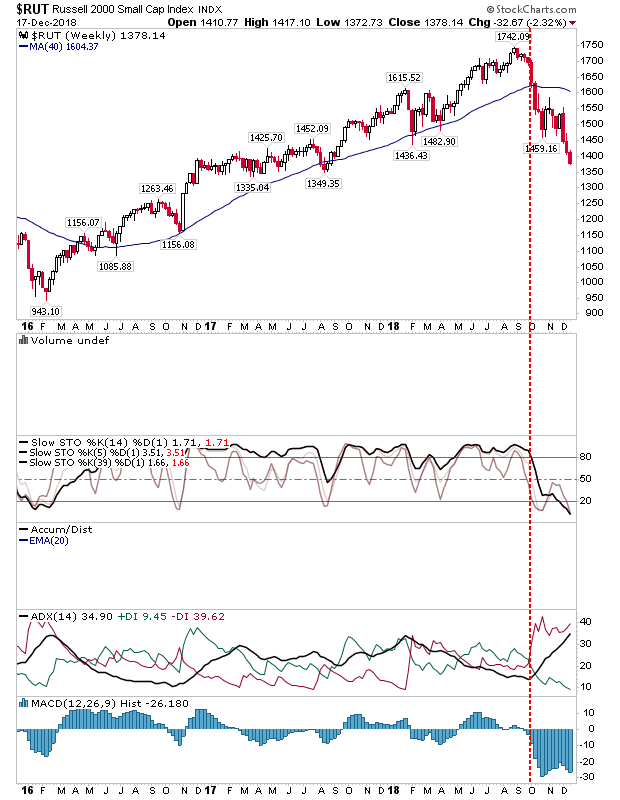
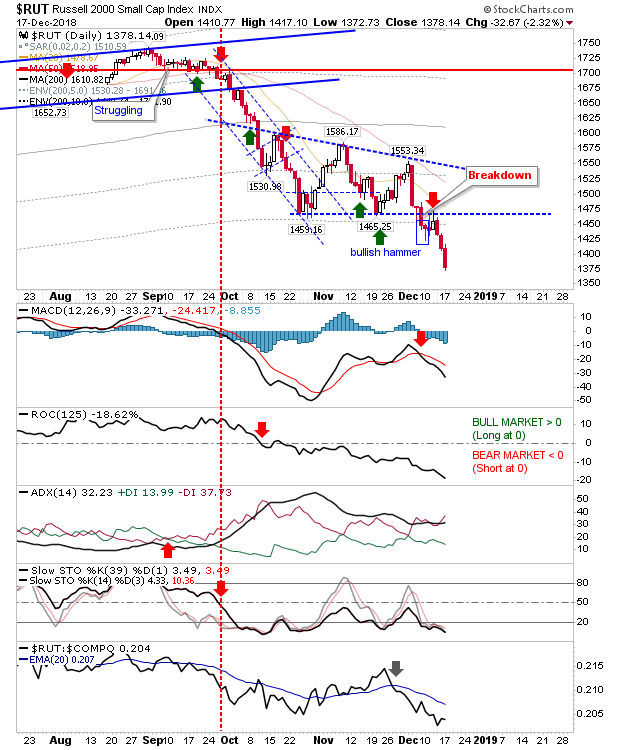
The Russell 2000 sits at 14.4% below its 200-day MA, only 0.3% from a "Strong Buy" on my investor watch. Investors can keep working it by adding to positions. Unlike the S&P and NASDAQ, there are nearby support levels to work, one of which can be found in the 1,335-1,350 zone (support for most of 2017). Traders looking for a bounce trade can probably start looking here.
RUT Daily ChartRUT Weekly Chart

For today, investors can keep on building their positions across all markets. Traders can probably start to look at buying the Russell 2000 and potentially covering any shorts in play.

Latest comments

Risk Disclosure: Trading in financial instruments and/or cryptocurrencies involves high risks including the risk of losing some, or all, of your investment amount, and may not be suitable for all investors. Prices of cryptocurrencies are extremely volatile and may be affected by external factors such as financial, regulatory or political events. Trading on margin increases the financial risks.
Before deciding to trade in financial instrument or cryptocurrencies you should be fully informed of the risks and costs associated with trading the financial markets, carefully consider your investment objectives, level of experience, and risk appetite, and seek professional advice where needed.
Fusion Media would like to remind you that the data contained in this website is not necessarily real-time nor accurate. The data and prices on the website are not necessarily provided by any market or exchange, but may be provided by market makers, and so prices may not be accurate and may differ from the actual price at any given market, meaning prices are indicative and not appropriate for trading purposes. Fusion Media and any provider of the data contained in this website will not accept liability for any loss or damage as a result of your trading, or your reliance on the information contained within this website.
It is prohibited to use, store, reproduce, display, modify, transmit or distribute the data contained in this website without the explicit prior written permission of Fusion Media and/or the data provider. All intellectual property rights are reserved by the providers and/or the exchange providing the data contained in this website.
Fusion Media may be compensated by the advertisers that appear on the website, based on your interaction with the advertisements or advertisers.
© 2007-2024 - Fusion Media Limited. All Rights Reserved.