Get 40% Off
⚠ Earnings Alert! Which stocks are poised to surge?
See the stocks on our ProPicks radar. These strategies gained 19.7% year-to-date.
Unlock full list

S&P 500’s Top 10 Stocks And Style Box Update

Published 02/17/2020, 03:57 AM
Updated 07/09/2023, 06:31 AM

These used to be the Top 10 names by market cap in the S&P 500. Procter & Gamble and Visa (NYSE:V) have ascended to the Top 10, Bank of America (NYSE:BAC) and Exxon (NYSE:XOM) Have dropped out. Procter & Gamble is not in this list but is found below. (PG is not owned for clients, and neither is Exxon.) MasterCard is making a push to try and get into the top 10 as well.
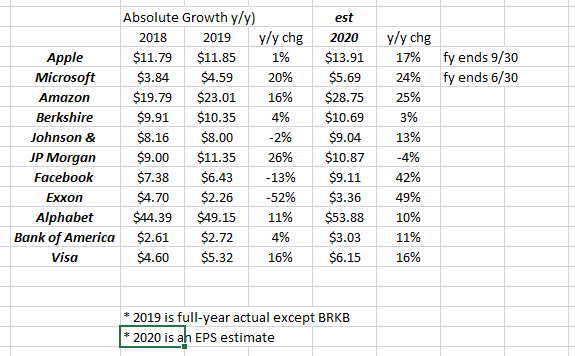
Top 10 S&P 500 Market Cap Wts

2019’s actual EPS was verified with Thomson Reuter’s Eikon (all but BRKB) but note the expected 2020 growth of the top 10 names after Q4 ’19’s earnings have been reported and guidance given.

It makes sense to stay with the mega-caps.

Top 10 S&P 500 names by market cap: SPY portfolio per Morningstar as of 2/14/2020)

  • 1.) Microsoft (NASDAQ:MSFT): 5.01%
  • 2.) Apple (NASDAQ:AAPL): 4.85%
  • 3.) Alphabet (NASDAQ:GOOGL): 3.24%
  • 4.) Amazon (NASDAQ:AMZN): 3.20%
  • 5.) Facebook (NASDAQ:FB): 1.83%
  • 6.) Berkshire: 1.58%
  • 7.) JP Morgan: 1.55%
  • 8.) Johnson & Johnson: 1.41%
  • 9.) Visa (NYSE:V): 1.27%
  • 10.) Procter & Gamble: 1.11%
  • Top 3 names as %: 13.7%
  • Top 5 names as %: 18%
  • Top 10 names as %: 25%
  • 5 of the top 5 names are all Technology and Communication Services, still basically all Tech.

    Summary/conclusion: The “average” expected 2020 EPS growth for the top 10 names in the S&P 500 by market cap is roughly 19% versus the expected 2020 S&P 500 EPS growth (IBES by Refinitiv) of 8% per the latest “This Week in Earnings”. If Bank of America (NYSE:BAC) and Exxon (NYSE:XOM) are excluded since they have dropped out of the S&P 500 Top 10, the remaining S&P 500 earnings growth is still 16%.

    ——————–

    Style Box Strategy:

    S&P 500 YTD Returns

    The iShares are used to track the various styles across the market caps. Not shown, but started in late 2019, was the Vanguard ETF’s tracking across their 6 style box ETF’s, large-to-small vcap, value to growth.

    The small cap space has not shown significant out-performance since 2016, versus the large-cap styles.

    Not really a surprise – this is well known by the market.

    What went on in 2016 that caused Small-caps and Value to have such a great year? Brexit, Presidential election, and the dollar was relatively weaker after peaking in early 2016.

    Summary / conclusion: Both the Style Box update and the Top 10 S&P 500 stocks are updated every 6 weeks so I thought that it was worth sharing with readers. Nothing here that hasn’t already been discussed in the mainstream financial media. The one metric that was surprising was the magnitude of earnings growth for the Top 10 S&P 500 weights, versus the entire index.

    Thanks for reading.

    Latest comments

    thanks
    Risk Disclosure: Trading in financial instruments and/or cryptocurrencies involves high risks including the risk of losing some, or all, of your investment amount, and may not be suitable for all investors. Prices of cryptocurrencies are extremely volatile and may be affected by external factors such as financial, regulatory or political events. Trading on margin increases the financial risks.
    Before deciding to trade in financial instrument or cryptocurrencies you should be fully informed of the risks and costs associated with trading the financial markets, carefully consider your investment objectives, level of experience, and risk appetite, and seek professional advice where needed.
    Fusion Media would like to remind you that the data contained in this website is not necessarily real-time nor accurate. The data and prices on the website are not necessarily provided by any market or exchange, but may be provided by market makers, and so prices may not be accurate and may differ from the actual price at any given market, meaning prices are indicative and not appropriate for trading purposes. Fusion Media and any provider of the data contained in this website will not accept liability for any loss or damage as a result of your trading, or your reliance on the information contained within this website.
    It is prohibited to use, store, reproduce, display, modify, transmit or distribute the data contained in this website without the explicit prior written permission of Fusion Media and/or the data provider. All intellectual property rights are reserved by the providers and/or the exchange providing the data contained in this website.
    Fusion Media may be compensated by the advertisers that appear on the website, based on your interaction with the advertisements or advertisers.
    © 2007-2024 - Fusion Media Limited. All Rights Reserved.