Get 40% Off
👀 👁 🧿 All eyes on Biogen, up +4,56% after posting earnings. Our AI picked it in March 2024.
Which stocks will surge next?
Unlock AI-picked Stocks

S&P 500: Where Will Index Go Next?

Published 12/09/2020, 12:17 AM
Updated 09/20/2023, 06:34 AM

Stocks managed to finish mostly higher yesterday, with the S&P 500 climbing about 30 basis points and the Q's climbing by around 35 bps. The S&P 500 managed to finish the day just over 3,700.

There isn’t a lot of news driving these markets at this point, just some headlines around stimulus. That lack of newsflow seems to allow some gambling to occur, which is squeezing some of the already overvalued stocks to push higher. There is nothing fundamental about these moves up in stocks like Roku (NASDAQ:ROKU) or Snowflake (NYSE:SNOW), or any others. It isn’t that these can’t be a great one or have a niche; the valuations they have achieved are just mind-blogging.

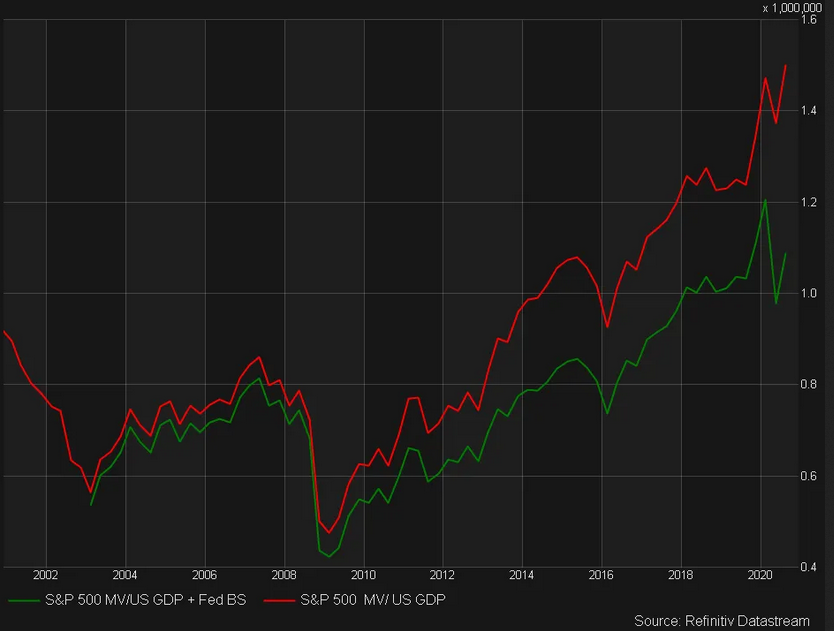
Here is a chart of the market cap of the S&P 500 to the US GDP along with GDP and the Fed balance sheet. It is pretty stunning to see just where we are currently.
S&P 500 Chart

S&P 500

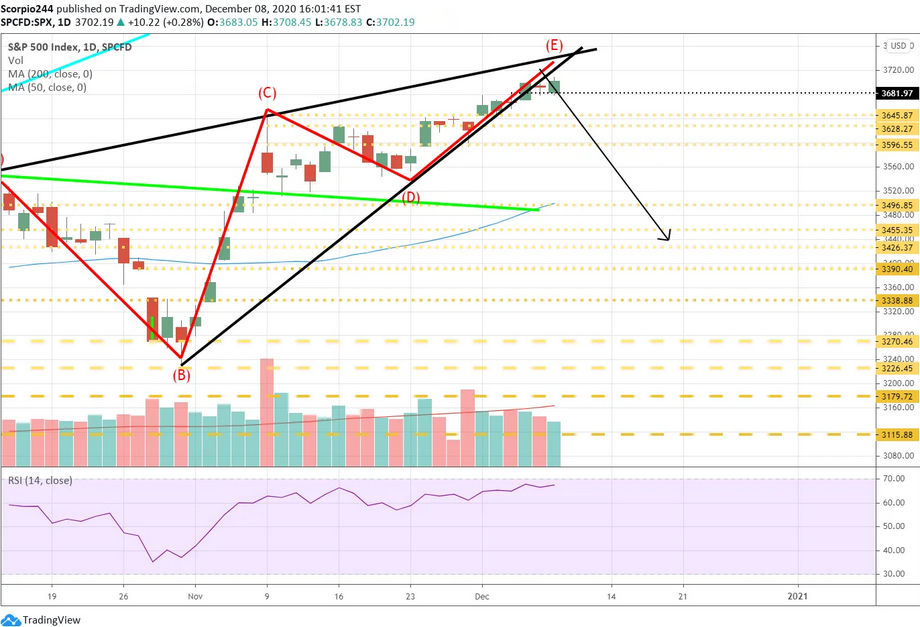
The S&P 500 finished outside of the rising wedge pattern we have been tracking. We are left to figure out where the index goes next, and while it is impossible to be certain, it would seem to me, that the next stop for this index will be 3630, and then likely lower from there.
S&P 500 Index Daily Chart

NASDAQ

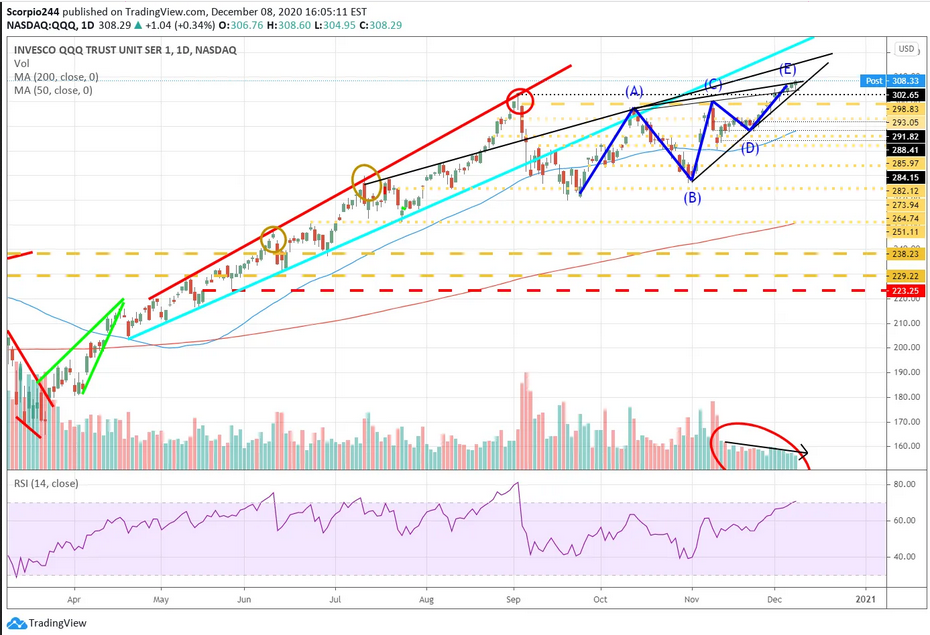
The Qs managed to finish with an RSI above 70 today. Volume continues to fall, which again suggests buying interest up is slowly grinding to a halt. These are negative signs in my opinion.
QQQ Daily Chart

Snowflake

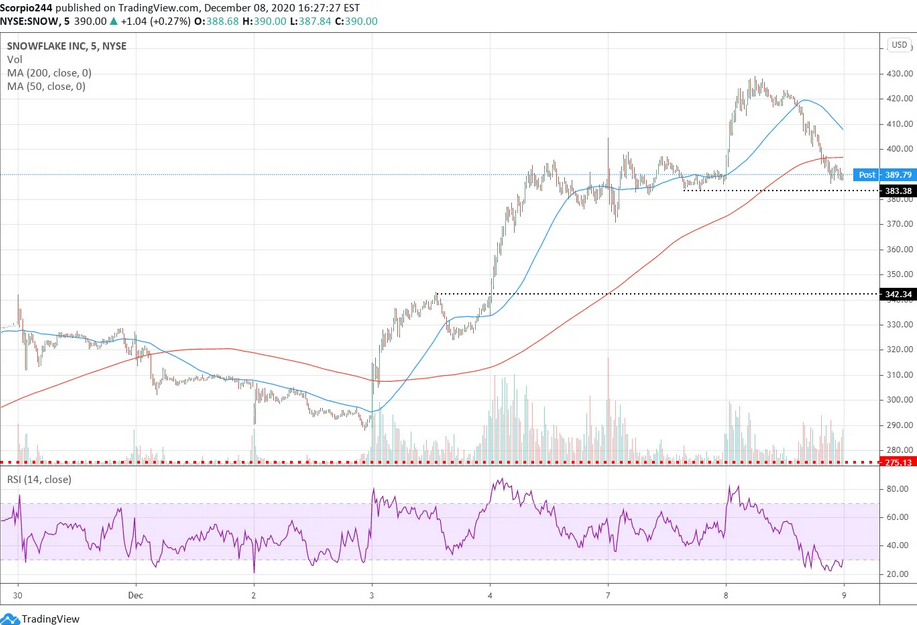
Snowflake is one example of what I think may have been a convexity squeeze gone bust. Yesterday, the stock was up nearly 10% today at one point but gave that all back to finish the day flat. Pretty startling event. Options volume has been pretty heavy the last few days, and that sent implied volatility levels higher along with the stock. Generally, speaking when we see this happening a convexity squeeze is taking place, and those never end well. A drop below $383 sets up a drop to around $342.
3rd party Ad. Not an offer or recommendation by Investing.com. See disclosure here or remove ads .

Snowflake Inc Chart

Tesla

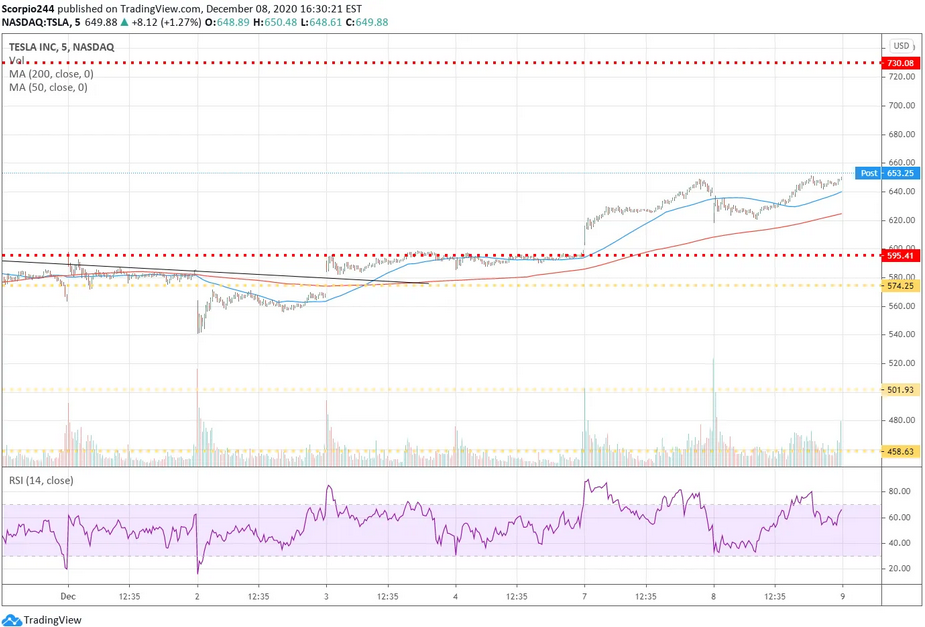
Tesla (NASDAQ:TSLA) started the day lower on news of another $5 billion equity raise. The stock managed to finish the day higher, and closing above resistance at $650. I still have resistance marked off at $730.
Tesla Inc Chart

Broadcom

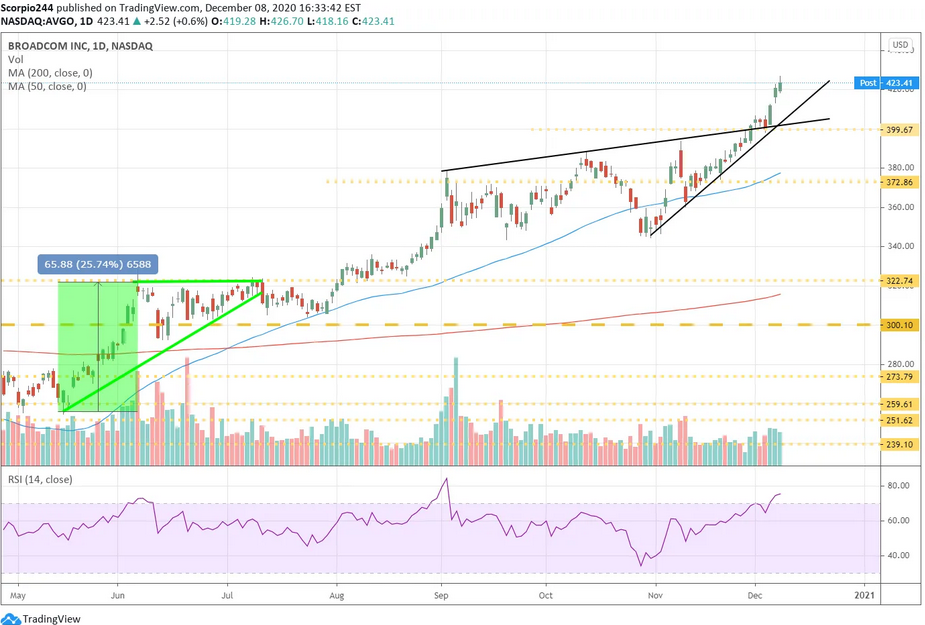
Broadcom (NASDAQ:AVGO) will report results on Thursday after the close. The stock has been rising ahead of those results. I still tend to think this stock is ahead of itself and is due for a post-earnings sell-off back to around $372.
Broadcomm Inc Daily Chart

Altria

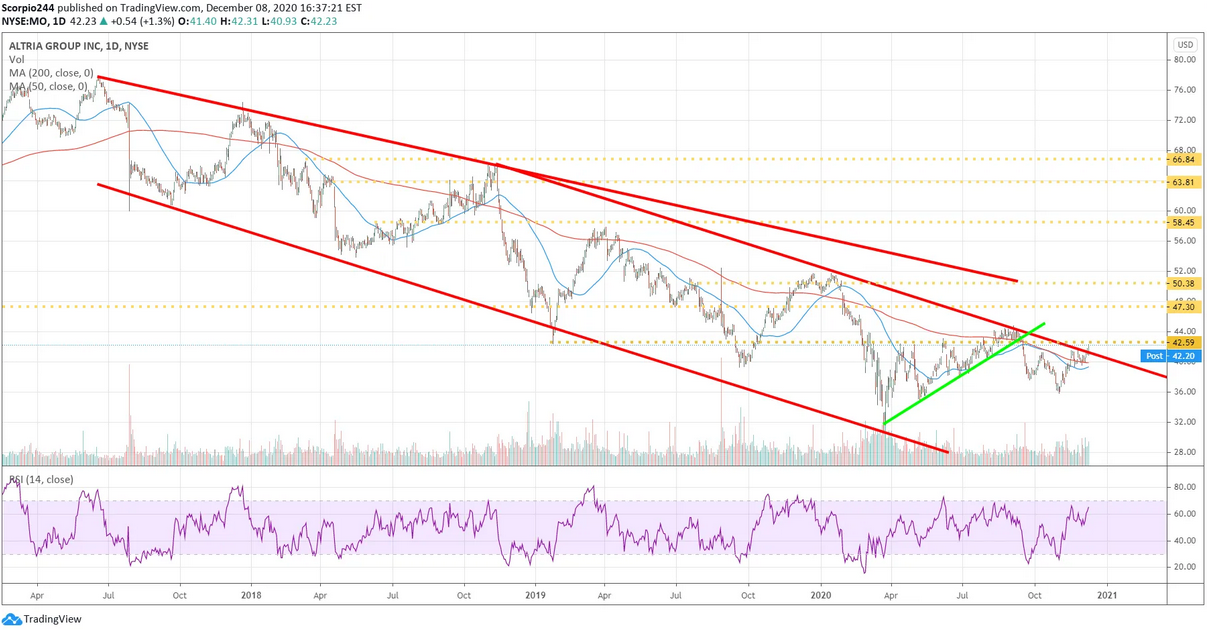
It looks like Altria (NYSE:MO) may finally be breaking out of this horrific downtrend, and if manages to get beyond $42.60 it likely climbs to around $47.30.
Altria Group Inc Daily Chart

Original Post

Latest comments

Mike's fund holds tsla and he talks of valuations? why?
Sure wish Monica Kingsley was still reporting here. Her petspective was a great balance.
Declan is great too! Mike nowadays, u know well...
reasonable
Why always so negative?
what means negative? against your analisys? any retracement is a better opportunity to get in
Only likes mo ☺️ lol
what
Risk Disclosure: Trading in financial instruments and/or cryptocurrencies involves high risks including the risk of losing some, or all, of your investment amount, and may not be suitable for all investors. Prices of cryptocurrencies are extremely volatile and may be affected by external factors such as financial, regulatory or political events. Trading on margin increases the financial risks.
Before deciding to trade in financial instrument or cryptocurrencies you should be fully informed of the risks and costs associated with trading the financial markets, carefully consider your investment objectives, level of experience, and risk appetite, and seek professional advice where needed.
Fusion Media would like to remind you that the data contained in this website is not necessarily real-time nor accurate. The data and prices on the website are not necessarily provided by any market or exchange, but may be provided by market makers, and so prices may not be accurate and may differ from the actual price at any given market, meaning prices are indicative and not appropriate for trading purposes. Fusion Media and any provider of the data contained in this website will not accept liability for any loss or damage as a result of your trading, or your reliance on the information contained within this website.
It is prohibited to use, store, reproduce, display, modify, transmit or distribute the data contained in this website without the explicit prior written permission of Fusion Media and/or the data provider. All intellectual property rights are reserved by the providers and/or the exchange providing the data contained in this website.
Fusion Media may be compensated by the advertisers that appear on the website, based on your interaction with the advertisements or advertisers.
© 2007-2024 - Fusion Media Limited. All Rights Reserved.