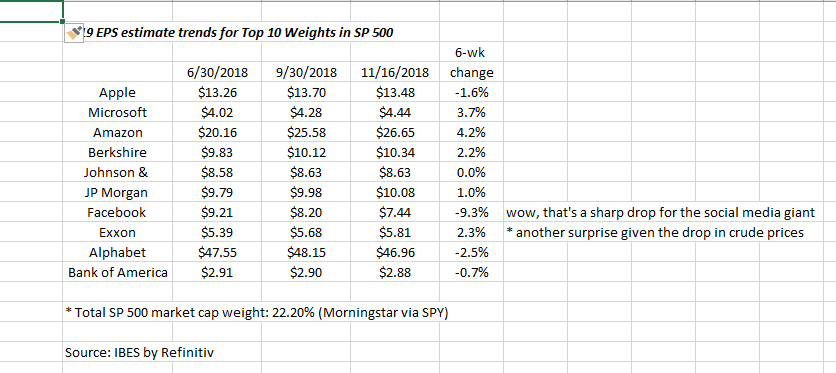
The Top 10 weights in the S&P 500 which constitute roughly 22% of the S&P 500 by market cap as of Friday, November 16th, 2016, and thus a substantial portion of the index.
To try and get some reality around the negative financial media and the ad hoc commentary around S&P 500 earnings, the above spreadsheet was created today for 2019 EPS estimate trends since mid-summer, 2018, just to get a feel for how bad 2019 might be given the current market environment. (Estimates are as of November 16th, 2018.)
Given this article from Tadas’s “Abnormal Returns” blog, which featured Ed Yardeni’s dire forecast for 2019 earnings I expected to be depressed after the exercise of laying out the 2019 estimates but instead was somewhat pleasantly surprised:
1. 5 of the top 10 names have actually seen upward revisions to 2019 estimates since the Sept ’18 quarter end, and 4 of those are in the top 6 market cap weight positions. Johnson & Johnson (NYSE:JNJ) is expected to show flat growth next year.
2. Facebook (NASDAQ:FB) is the sharpest negative revision down 9% since September 30th, probably not a surprise if you’ve been watching the stock.
3. What surprised me was Exxon’s (NYSE:XOM) 2019 estimate given the price action in crude. Granted XOM is a fully-integrated international so it can benefit from crude price swings in both directions, but I expected Exxon to show a sharp drop in earnings growth in 2019 or at least show negative revision trends for 2019 and that wasn’t the case.
5.) Microsoft (NASDAQ:MSFT) and Amazon (NASDAQ:AMZN) still look pretty solid – those revisions are healthy and positive. Amazon’s market cap hit a trillion dollars on September 4th, 2018, when the price topped out at $2,050 per share, so the stock has fallen 22% since its peak. Amazon corrected 32% in 8 weeks in Q1 ’18 when it fell from $700 to $474.
Summary / conclusion: 22% of the S&P 500’s market cap is telling you – as of 6 weeks into the correction – that 2019 doesn’t look that bad in terms of 2019 EPS trends. Could that change from here? Sure, the trends could reverse or accelerate to the downside, but look at the headlines relative to the EPS trends. Also, 2019 could be another year of P.E compression as this blog discussed last week.
Microsoft has been clients' largest position for 5 years. Amazon is now in the top 5 just given its appreciation this year, with the stock up 38% YTD. Financials populate the rest of the top 10 and Health Care, with Financials disappointing this year.
Right now as this data indicates I think there is too much pessimism around 2019 S&P 500 EPS estimates.
