Get 40% Off
⚠ Earnings Alert! Which stocks are poised to surge?
See the stocks on our ProPicks radar. These strategies gained 19.7% year-to-date.
Unlock full list

S&P 500: The Buyable Pullback Continues

Published 09/28/2021, 02:22 PM

Over the past two months, I used the Elliott Wave Principle (EWP) to forecast the S&P 500 (SPX) would reach SPX4550-4600 before a 200-300p correction should start. Two weeks ago, see here, I anticipated the correction had started because of A) the number of consecutive down days had exceeded prior correction lengths since June and B) SPX4546 was reached in a complete five-wave advance, C) there was negative divergence on the technical indicators (red dotted arrows).

In broad strokes, I was looking for “A (red) intermediate wave-iv pullback to SPX3985-4230 should be in the cards with the upper end preferred (downside disappoints and upside surprises in Bull markets). From there, I expect the 5th wave rally to complete (black) major wave-3 around SPX4767-5012 before an even larger correction starts (major wave-4), with a last gasp rally to around SPX6000 to finish the entire Bull market that started after the 1929 crash.”

However, the chart shows the detail I was looking for during this correction since Sept. 14. Allow me to explain below.

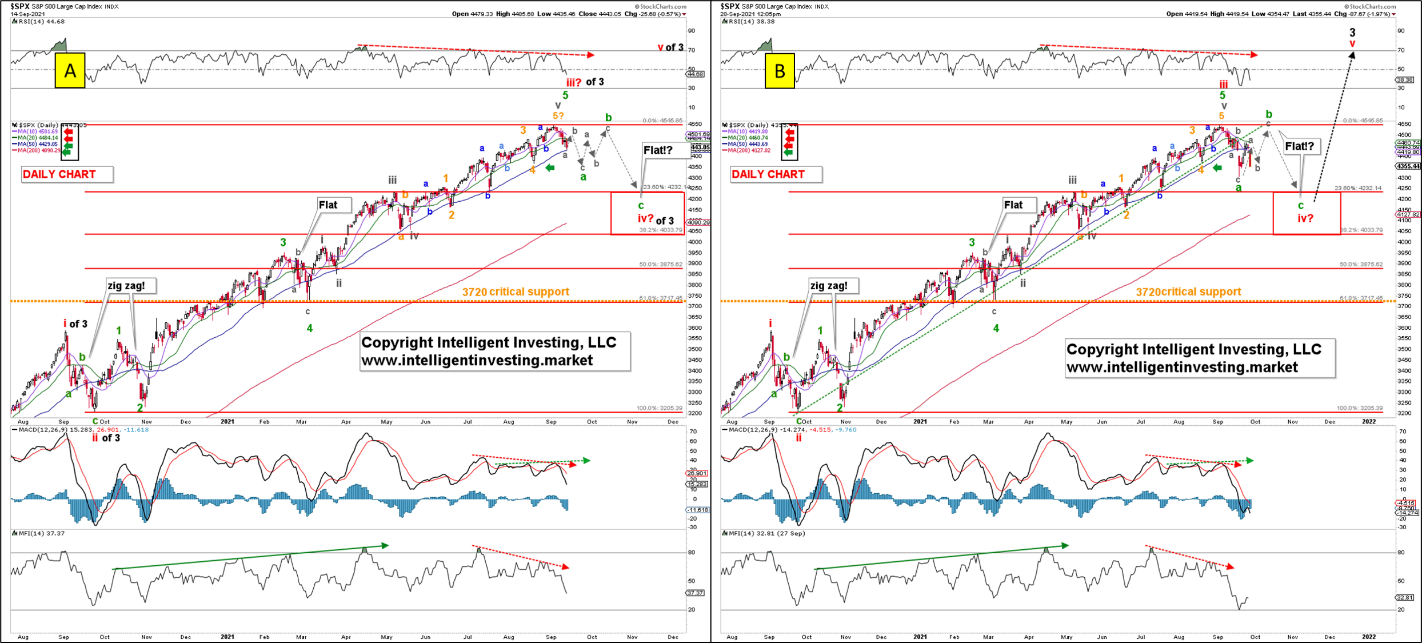
On Sept. 14, I detailed the preferred EWP-path I was looking for in this correction: a short-term bounce to ~SPX4500+/-10 (grey wave-b of green wave-a). Then a fast drop to ~SPX4340+/-10 (grey wave-c of green wave-a), and another rally to ~SPX4450+/-10 (grey wave-a of green wave-b) followed by another drop ~SPX4390+/-10 and rally to ~SPX4525+/-25 (grey wave-b and c of green wave-b; respectively). Let’s see how the SPX filled this in?!

The index bounced to SPX4485 on Sept.16, dropped to SPX4306 on Sept. 20, rallied to SPX4465 on Sept. 23, and sits at SPX4350. The EWP was again able to foresee the market’s twists and turns two weeks ahead of time. I, therefore, expect a rally soon again from around current levels, before the last drop to ideally SPX4230 kicks in (green, minor wave-a). However, if the index decides to drop to SPX4230+/-25 more immediately, I will view the correction as completing more quickly.

Bottom line

Eighteen days ago, I warned to “watch for a break below SPX4465 and especially SPX4365 to signal an intermediate-term pullback is underway, which should be an excellent buying opportunity for another run higher to SPX4800—5000.” Both breaks happened, and the SPX is now in a confirmed intermediate-degree pullback. Since the index is IMHO in a 4th wave, the correction should become complex and long-drawn. Just as I showed here how it would fill in over the past two trading weeks, I expect more whipsawing over the next few weeks. However, if the market decides to drop to SPX4230+/-25 more immediately, I will consider the correction complete sooner than later.

Latest comments

Phenomenal. Again!
Would you consider the correction now complete for green c that the S&P has reached the low at 4,278 (close to 4,230+25=4,255), or it still has a ways to go? Thanks!
Awesome Dr! Thanks!
Awesome analysis 👏👏👏
Thanks, Dr.
Your idea of a 'flat' is actually quite intriguing. Because of the small print, it took me some time to discover the different dates of chart A and B. However, your point being that the structure of the current movement and which we may discover on our way (the potential flat), will give evidence to the forthcoming movement when the correction is over.
Exactly. Sorry anout the small print of the chart, but the publisher reduces the original size a lot. My premium members get of course the full version. Daily! Trade safe!
 And I recommend this report, although I personally am not a subscriber! Let's see how it works out!
 ur always more than welcome to join my members' ranks or wait several weeks for the next "told ya so" update ;-) u pick :-)
Lastly, SPX earnings will so badly weaken with Overzealous producers and with lack of demand unable to pass on costs to end customer
Buyable pullback ...or a massively overvalued market ignoring inflation, Chinese tensions, debt ceilings, tax hikes on the horizon to fund even more spending, supply issues and an economy massively overheating??? I think the only person on the planet who wasn't predicting a huge inflation shift was Powell who continued printing money like no tomorrow and now only coming to his senses about 6 months too late. Market values are largely built on this printed cash having to find a home - so has been thrown at anything which sticks! The natural growth of S&P, had there been no Covid, would have it at about 3k - 3.5k now - not 4.5k. So still 20%-25% overvalued in my opinion. Same with Nasdaq and Dow when looking at trajectory pre covid, debt levels and long-term PE Ratio projections (plus all the other risks as noted above).
For lower unemployment rate SPX need not be pumped up. I am firing Dr. Jerome Bubble right now.
So the trend is our friend, but 4th waves have no preferences. The target is 3% lower, but first expect up - unless we go straight down. The problem with RSI's is that they can go to zero and stay there. I have an example on hand. If the market goes up, go short. If the market goes down, go long - but if there is a 3% drop still on the downside, it's too early to intake any seasonable position.
SPX is ideally pointing towards 3200 when Biden came in. The 1350 point Biden froth will go away EW tells me that 3200-3000 will be the correction target. EW tells whatever you want to see in a chart. ha ha
earth to investors, come in investors!!  ..  the era of buying pullbacks is coming to an end. markets have topped out. they have you right where they want you ... too fat & sluggish to pull away from the trough. be cautious out there  .. things do eventually change & this bull market is on its last legs.
Thanks doc!  I owe you a steak after today :)
yumm!
hi
Risk Disclosure: Trading in financial instruments and/or cryptocurrencies involves high risks including the risk of losing some, or all, of your investment amount, and may not be suitable for all investors. Prices of cryptocurrencies are extremely volatile and may be affected by external factors such as financial, regulatory or political events. Trading on margin increases the financial risks.
Before deciding to trade in financial instrument or cryptocurrencies you should be fully informed of the risks and costs associated with trading the financial markets, carefully consider your investment objectives, level of experience, and risk appetite, and seek professional advice where needed.
Fusion Media would like to remind you that the data contained in this website is not necessarily real-time nor accurate. The data and prices on the website are not necessarily provided by any market or exchange, but may be provided by market makers, and so prices may not be accurate and may differ from the actual price at any given market, meaning prices are indicative and not appropriate for trading purposes. Fusion Media and any provider of the data contained in this website will not accept liability for any loss or damage as a result of your trading, or your reliance on the information contained within this website.
It is prohibited to use, store, reproduce, display, modify, transmit or distribute the data contained in this website without the explicit prior written permission of Fusion Media and/or the data provider. All intellectual property rights are reserved by the providers and/or the exchange providing the data contained in this website.
Fusion Media may be compensated by the advertisers that appear on the website, based on your interaction with the advertisements or advertisers.
© 2007-2024 - Fusion Media Limited. All Rights Reserved.