'Money is made sitting, not trading' is an often-quoted statement from Jesse Livermore. That is especially true with regard to the US American stock market. The past year has not treated buy-and-hold investors well. US equities were characterized by strong moves in either direction. Deutsche Bank (DE:DBKGn) research showed that roughly 90% of dollar-denominated assets were in negative territory at the end of October 2018. This year was clearly a trader’s market.
Technical analysis can provide helpful hints with regard to trend recognition. The following examples provide an overview of how we navigated our clients through the market action of the past year. It concludes with our current assessment of the market.
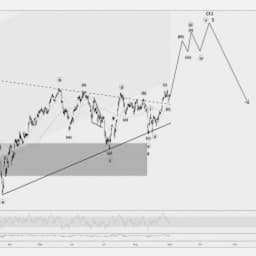
S&P 500

The US market was cleared for take-off with the presidential election of 2016. An upside trend formed, which we followed along. That trend was not finished as our charts showed one year ago.
Those familiar with Elliottwaves will recognize that the very first chart shows a very bullish interpretation of the market on October 17, 2017. We judged the index to accelerate in a 3rd wave to the upside. That interpretation got confirmed soon and the index increased higher up. We expected some lower degree correction rather than the end of the bull market trend as year-end approached. Complacency was omnipresent in the market at that time as no material pullbacks corrected the bull run.

Our bullish outlook on US equities changed on the 26th of January 2018. Almost nobody expected a market correction at that point. Our analysis warned clients that we expect “S&P 500 investors to have less fun during the next weeks” and that the “Nasdaq 100 wheels are falling off soon”. We did not know the exact magnitude nor the exact timing. However, we were confident that a bigger correction was right around the corner. Our analysis that was posted just within hours of a significant top got confirmed. It led to a double-digit decline during the next couple of weeks.

The Elliott wave framework does not only provide helpful hints regarding reversals. It also provides hints regarding the maturity of trends. That’s the sitting part of Jesse’s quote. On February 9th, 2018 we’ve called a sharp rally and made a case to buy the dip while other’s were screaming “October 1987!”. We were confident that the trend had another leg up. A sharp countertrend bounce was likely even if we were wrong regarding our call to see another top. Therefore, we stressed the importance to let the rebound develop and forecasted at least a spike into the 2,700-2,800 area. The market rallied within a few hours of our publication to the upside.

We were probably the first widely read analysts who figured the exact Elliott wave pattern that the S&P 500 was unfolding within minor wave 4, which ended in April 2018. The major US index reached a new all-time high eventually. Along the way up, we prepared clients for a major reversal. The reversal unfolded, which became visible during October. Moreover, the October selloff was probably just an appetizer for a bigger selloff if our analysis proves correct going forward.
Doesn’t that mean that it is best to unwind everything and wait until things cleared up? It depends on the objectives that are followed. For some, it is the right conclusion whereas others can look for opportunities that the bear market brings along. Our October 30 chart was sent close to a buy signal for the Nasdaq 100, FXI and Nifty 50. It took just a week for the three indices to unfold a rally that is almost equal to the long-term average return that investors have seen in equities. Two-thirds of that signal got realized on November 7 2018.

Bear markets are big opportunities for those who understand the big picture and risks for those who don’t. Sharp and sizable rallies unfolded during bear markets historically. Moreover, those who can time countertrend fades get rewarded quickly. The exercise just changes from buying the dip to selling the rally. Last but not least, bear market bottoms are buying opportunities that do not arise often over our lifetime. The key is first and foremost to know which environment unfolds. Is it a trading or a buy-and-hold market? Our assessment is that US equity indices are most likely still within a countertrend correction to the sell-off that we witnessed during October. The corrective structure is probably going to complicate going forward. Eventually, it will most likely resolve to the downside. Hence, we are probably in a trader’s market!

Our premium short-term analysis focuses on identifying dips and countertrend rallies within their paramount trends.