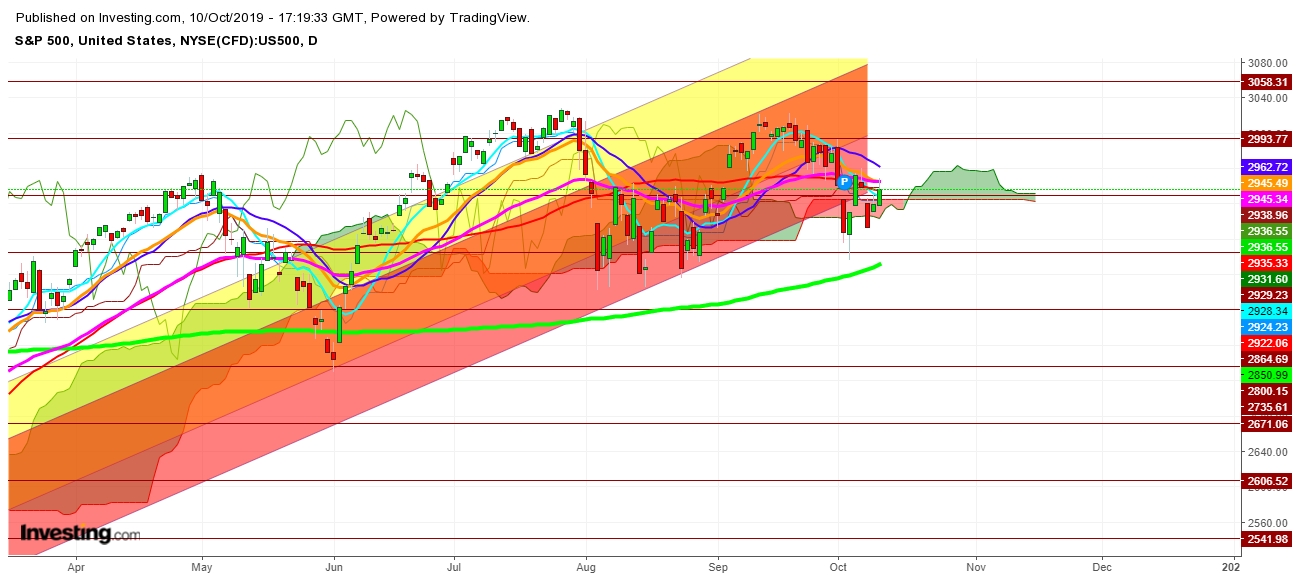
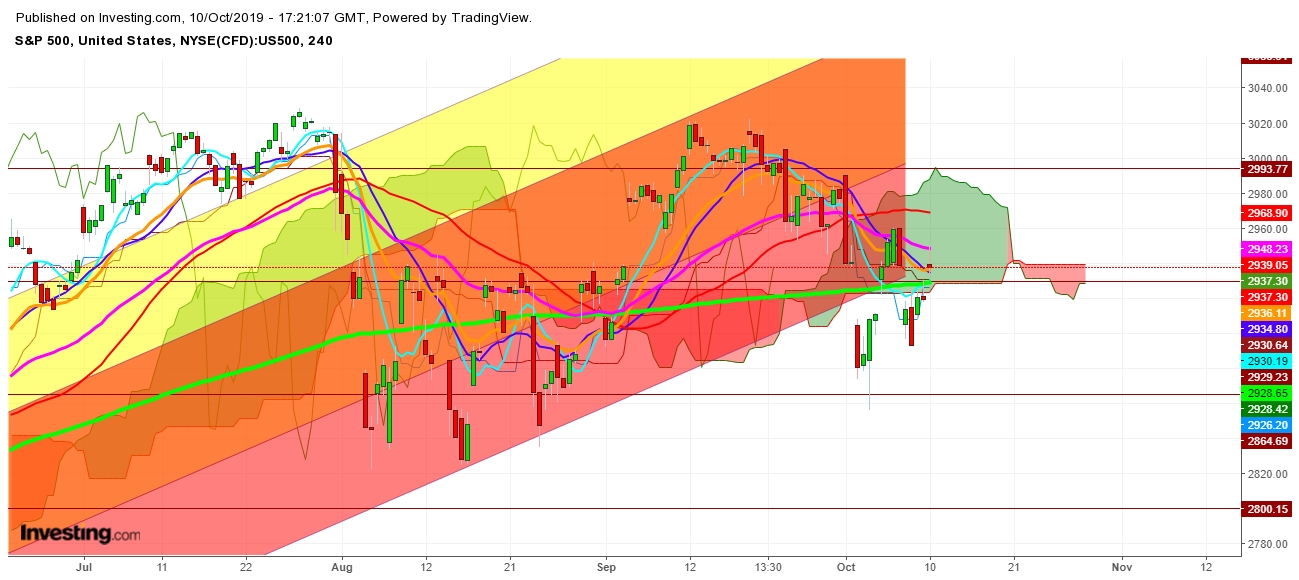
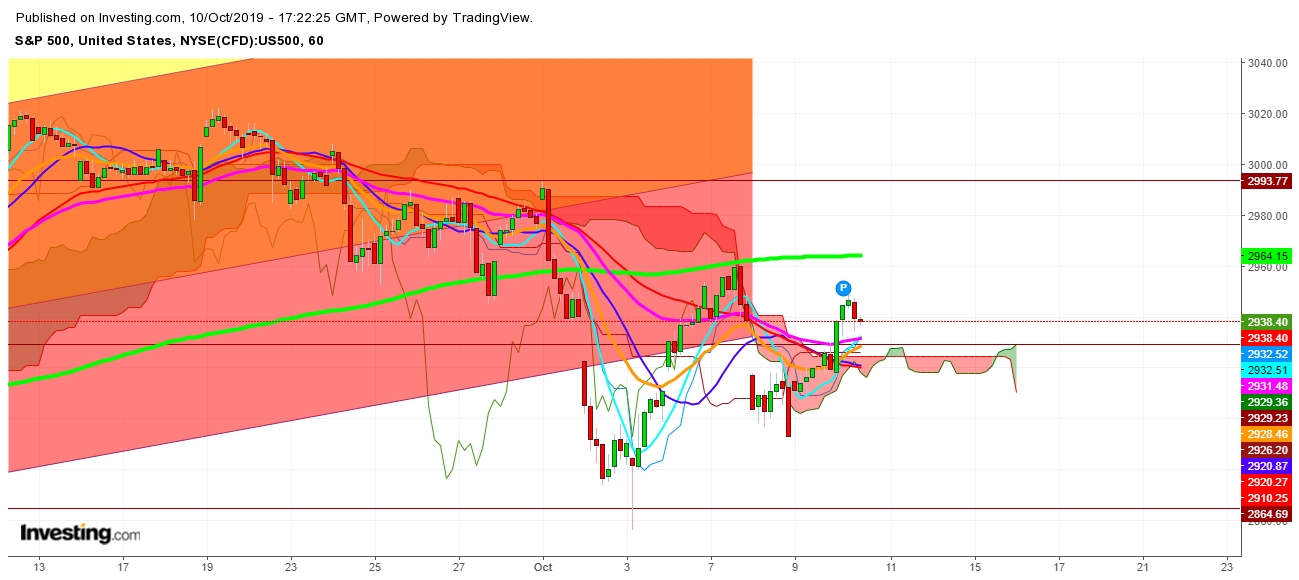
Since the trade talks scheduled for today and Friday to find a final breakthrough, a report that Beijing has urged Washington to stop unreasonable pressure on Chinese companies dragged the main index in to the red, S&P 500 seems to swing amid hopes and fear. Although S&P 500 looks to face stiff resistance at 2949, but hopes of a positive outcome can intensify bullish sentiments to push S&P 500 steeply upward to test the recent highs at 3027; but only a little bit of negative outcome looks evident enough to trigger heavy sell off.
No doubt that the China looks not too eager to reach a trade deal, but the growing fear of persisting weakness in American economy due to year-long tariff trade tussle, U.S. President Mr. Donald Trump looks under pressure to get at least a partial deal to strengthen U.S. economy to ensure his re-election; before his impeachment risk rises. On the other hand, uncertainty seems to prevail at higher scale, as the investors have been constantly receiving mixed signals about the tariff trade deal, which seems to have turned in to an ordeal within last few days; as the two largest economies in the world are not able to reach at any conclusion.
Finally, I conclude that despite a plethora of efforts, if the United States and the China are not be able to reach at any final resolution; as they have discovered “Tariff as a new Tool” during the last one year. No doubt, if both the countries do not come forward with a final resolution, based on mutual consent, global economic slowdown fear will shortly turn into global economic meltdown; leading to next global equity crash in 2019.
Secondly, sustenance of gold futures above the level of $1476 to $ 1555 looks evident enough for a steep upward move towards the range of $1611 to $1681 within this month; which will confirm the advent a long recessionary phase.
To watch my upcoming videos on S&P 500, subscribe my YouTube Channel “SS Analysis.”


Disclaimer
1. This content is for information and educational purposes only and should not be considered as an investment advice or an investment recommendation. Past performance is not an indication of future results. All trading carries risk. Only risk capital be involved which you are prepared to lose.
2. Remember, YOU push the buy button and the sell button. Investors are always reminded that before making any investment, you should do your own proper due diligence on any name directly or indirectly mentioned in this article. Investors should also consider seeking advice from an investment and/or tax professional before making any investment decisions. Any material in this article should be considered general information, and not relied on as a formal investment recommendation.
