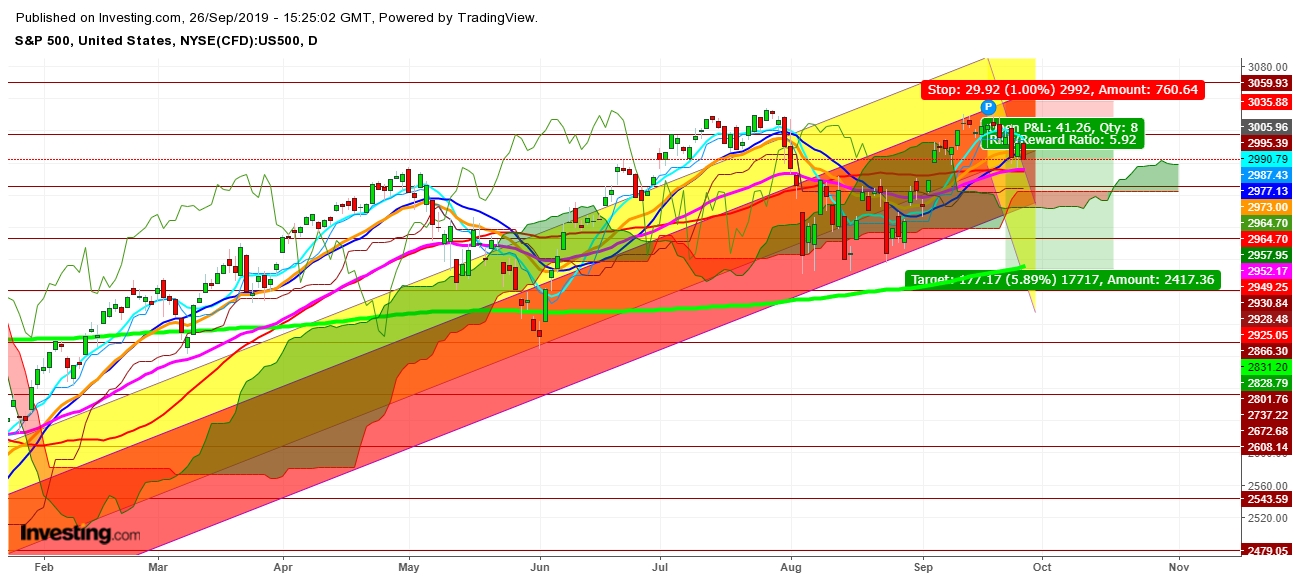
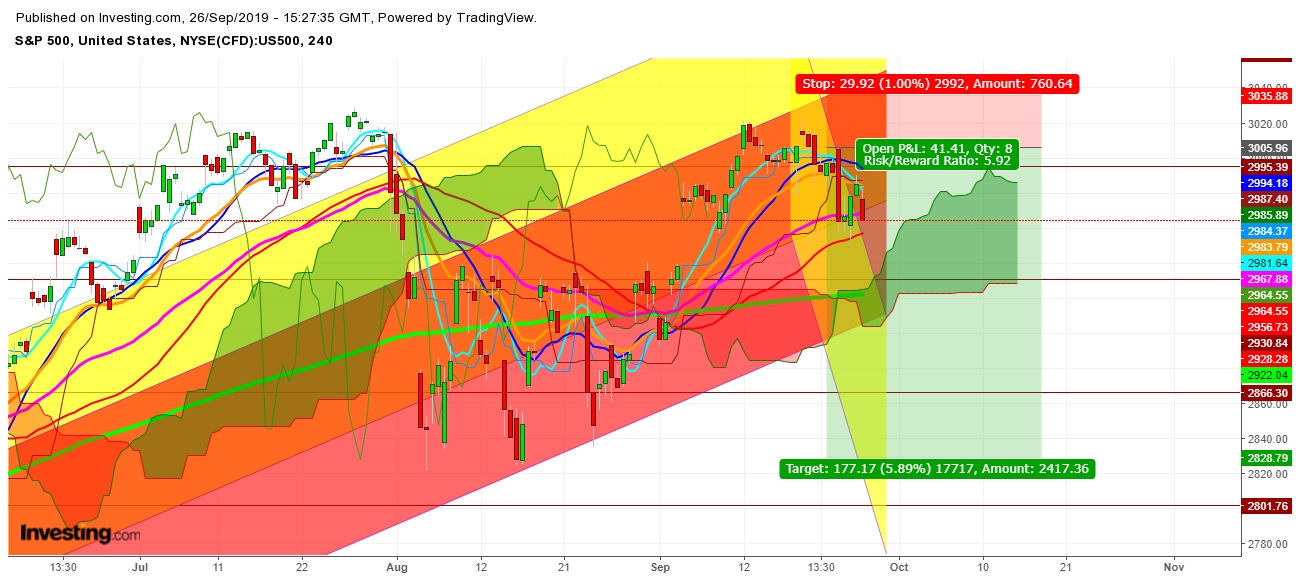
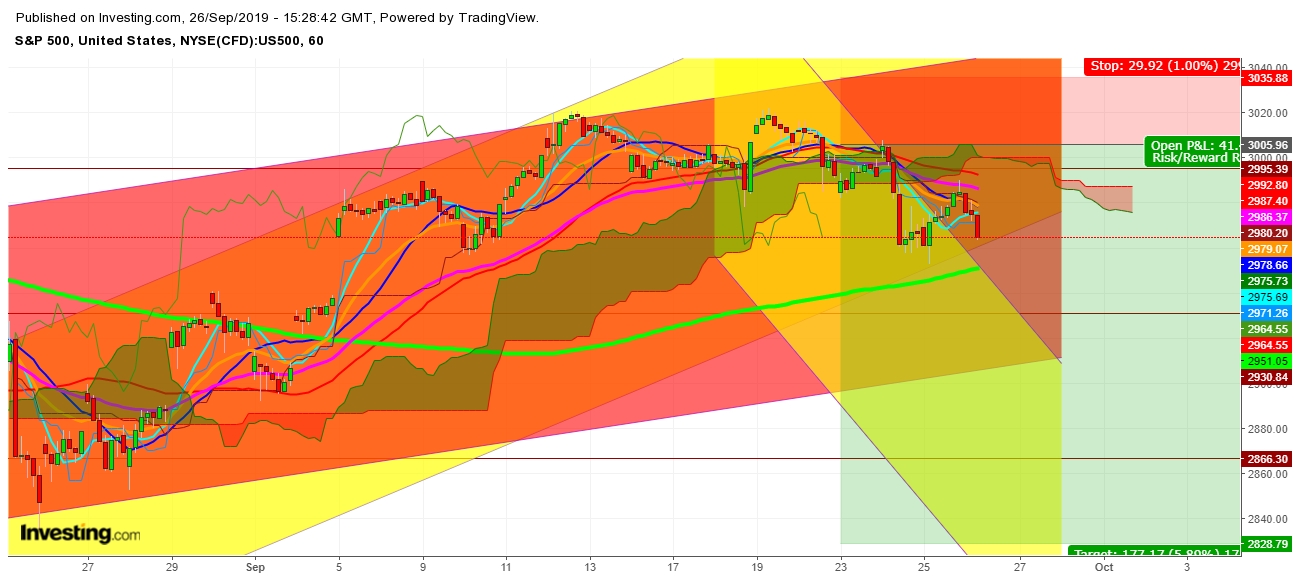
On analysis of the movements of S&P 500, in different time frames, I find that fresh developments related to a formal impeachment inquiry into President Donald Trump are having an impact. As we are heading once again toward the anniversary of October 2018 Selloff, panic seems to hover around the equity market's growing fear of global economic slowdown. I find that despite the plethora of stimulatory measures at every nook and corner of the world, most of the equity markets look ready to repeat the history once again during the upcoming week.
I find that long lasting damaging impacts of the Sino-U.S. tussle look evident enough to encourage most of the central banks to boost their stimulus measures. The European Central Bank has just boosted stimulus measures and investors aren’t expecting a U.S. recession until at least next year. But this week’s release of disappointing economic data in France and Germany came as a sharp and unpleasant wake-up call for fans of equities, which have returned a whopping 19% this year. I find that the recession risk remains uncomfortably high for the eurozone, due to the impact from continuing trade tensions and a global slowdown, which are taking their toll on Europe. Business expectations in Germany fell to the lowest in a decade this month and the slump in manufacturing pushed the region’s largest economy closer to recession.
Finally, if the S&P 500 looks ready to break the level of 2949 before the weekly close, a sustainable move below this level may drag down the S&P 500 below 2929 before October 1, 2019. Strong gold prices look evident enough to reflect the real impact of geopolitical moves on the movements of global equity markets. Repeated attempts of gold futures to maintain above $1515 look evident enough to reflect the continuation of an exhaustive move in S&P 500 index.


Disclaimer
1. This content is for information and educational purposes only and should not be considered as an investment advice or an investment recommendation. Past performance is not an indication of future results. All trading carries risk. Only risk capital be involved which you are prepared to lose.
2. Remember, YOU push the buy button and the sell button. Investors are always reminded that before making any investment, you should do your own proper due diligence on any name directly or indirectly mentioned in this article. Investors should also consider seeking advice from an investment and/or tax professional before making any investment decisions. Any material in this article should be considered general information, and not relied on as a formal investment recommendation.
