Get 40% Off
⚠ Earnings Alert! Which stocks are poised to surge?
See the stocks on our ProPicks radar. These strategies gained 19.7% year-to-date.
Unlock full list

S&P 500 Snapshot: Up 0.5% WoW

Published 04/22/2018, 05:38 AM
Updated 07/09/2023, 06:31 AM

The S&P 500 rose and fell this week, ending Friday up 0.5% from the same time last week. The index was down -0.85% from Thursday and is down 0.95% YTD.
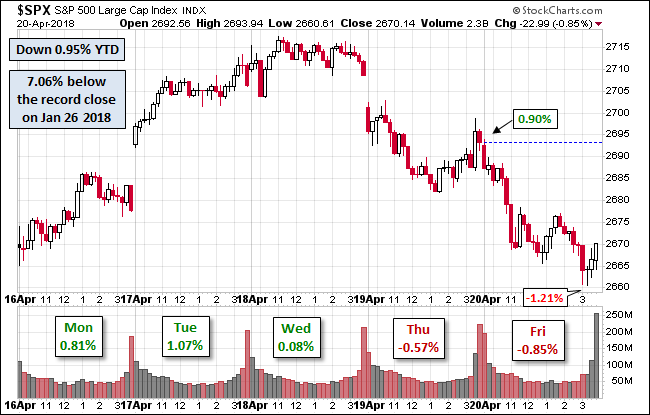
S&P 500 Performance Chart

The U.S. Treasury puts the closing yield on the 10-Year note at 2.96%.

Here is a daily chart of the S&P 500. Today's selling puts the volume at its 50-day moving average.
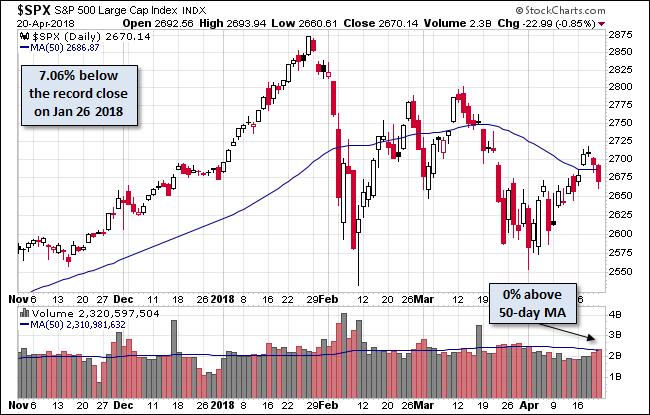
S&P 500 Daily Chart

Here's a snapshot of the index going back to December 2008.
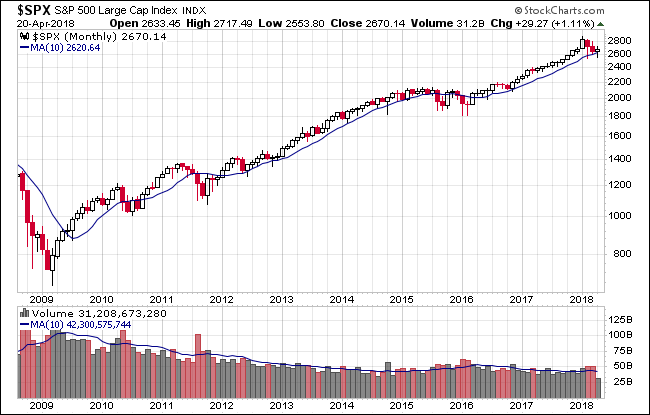
S&P 500 Performance Since 2008

A Perspective on Drawdowns

Here's a snapshot of record highs and selloffs since the 2009 trough.

S&P 500 Drawdowns

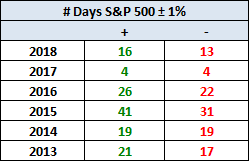
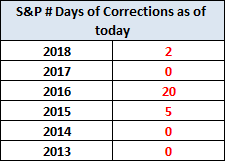
Here's a table with the number of days of a 1% or more change in either direction and the number of days of corrections (down 10% or more from the record high) going back to 2013.

# Days S&P 500 +/- 1%
S&P 500 # of Days of Correction as of Today

Here is a more conventional log-scale chart with drawdowns highlighted.
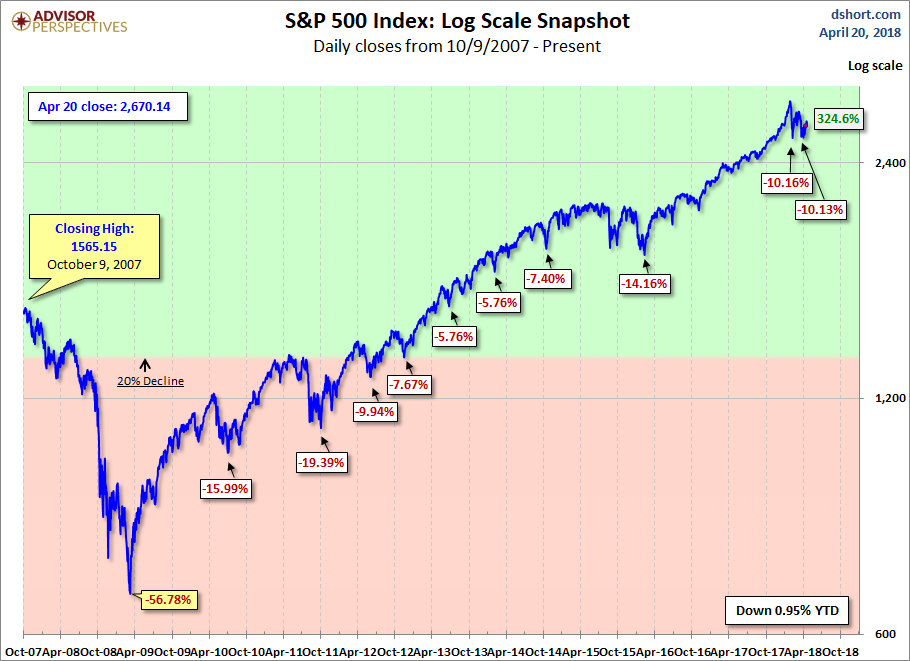
S&P 500 MAs Log Scale

Here is a linear scale version of the same chart with the 50- and 200-day moving averages.

S&P 500 MAs

A Perspective on Volatility

For a sense of the correlation between the closing price and intraday volatility, the chart below overlays the S&P 500 since 2007 with the intraday price range. We've also included a 20-day moving average to help identify trends in volatility.
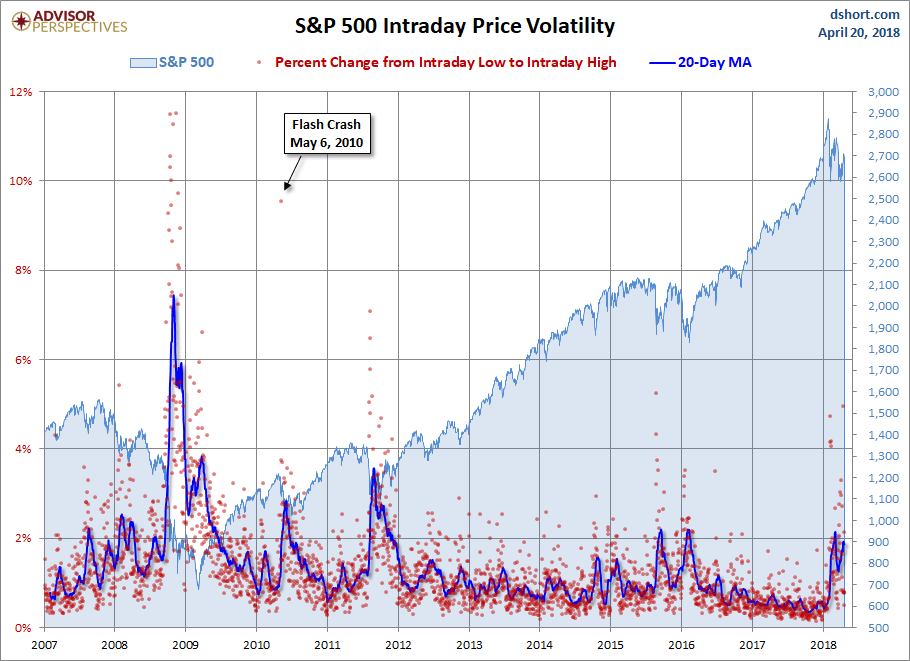
S&P 500 Intraday Volatility

Original post

Latest comments

Risk Disclosure: Trading in financial instruments and/or cryptocurrencies involves high risks including the risk of losing some, or all, of your investment amount, and may not be suitable for all investors. Prices of cryptocurrencies are extremely volatile and may be affected by external factors such as financial, regulatory or political events. Trading on margin increases the financial risks.
Before deciding to trade in financial instrument or cryptocurrencies you should be fully informed of the risks and costs associated with trading the financial markets, carefully consider your investment objectives, level of experience, and risk appetite, and seek professional advice where needed.
Fusion Media would like to remind you that the data contained in this website is not necessarily real-time nor accurate. The data and prices on the website are not necessarily provided by any market or exchange, but may be provided by market makers, and so prices may not be accurate and may differ from the actual price at any given market, meaning prices are indicative and not appropriate for trading purposes. Fusion Media and any provider of the data contained in this website will not accept liability for any loss or damage as a result of your trading, or your reliance on the information contained within this website.
It is prohibited to use, store, reproduce, display, modify, transmit or distribute the data contained in this website without the explicit prior written permission of Fusion Media and/or the data provider. All intellectual property rights are reserved by the providers and/or the exchange providing the data contained in this website.
Fusion Media may be compensated by the advertisers that appear on the website, based on your interaction with the advertisements or advertisers.
© 2007-2024 - Fusion Media Limited. All Rights Reserved.