
Earnings resiliency
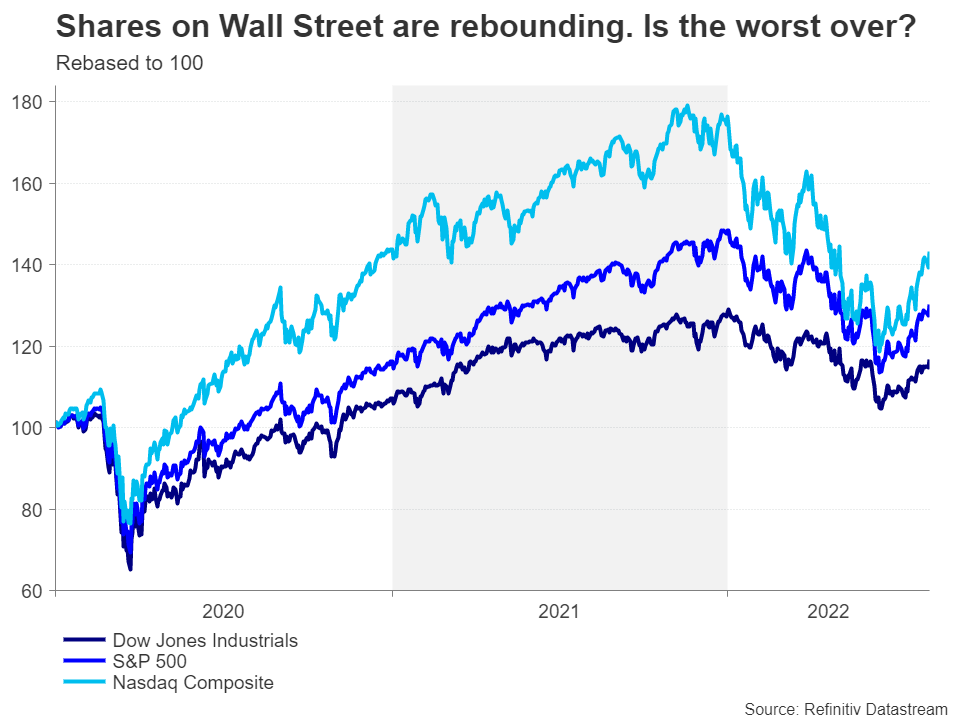
After two years of a stimulus-fuelled rally, stocks hit turbulence at the start of 2022. Traders had to ride through several storms, with everything from central banks turning off the stimulus taps, a war in Europe, an energy crisis and fresh draconian lockdowns in China thrown at them, all amidst an ongoing chaos in global supply chains. The combined effect of the aforementioned has devastated the growth outlook for the global economy, and by extension, the outlook for corporate earnings.
But the Q2 earnings results demonstrated that the situation isn’t quite so dire, at least not yet. With the earnings season now starting to wind down, 75% of S&P 500 companies that have reported beat their earnings per share (EPS) estimates according to FactSet. Although it’s true that investors had set a low bar going into the season and many businesses are clearly struggling to grow their revenue and are even laying off staff, the overriding message has been that corporate America’s balance sheet will likely only suffer a minor dent once everything has blown over.
Bond yields may have peaked
Nevertheless, it’s debatable whether the better-than-expected earnings are what really put a floor under the selloff, or if the timing was simply coincidental. A closer look would suggest that it was the peak in Treasury yields, specifically the yield on the 10-year note, that sparked the latest upswing on Wall Street. The question everyone is asking though, is it sustainable?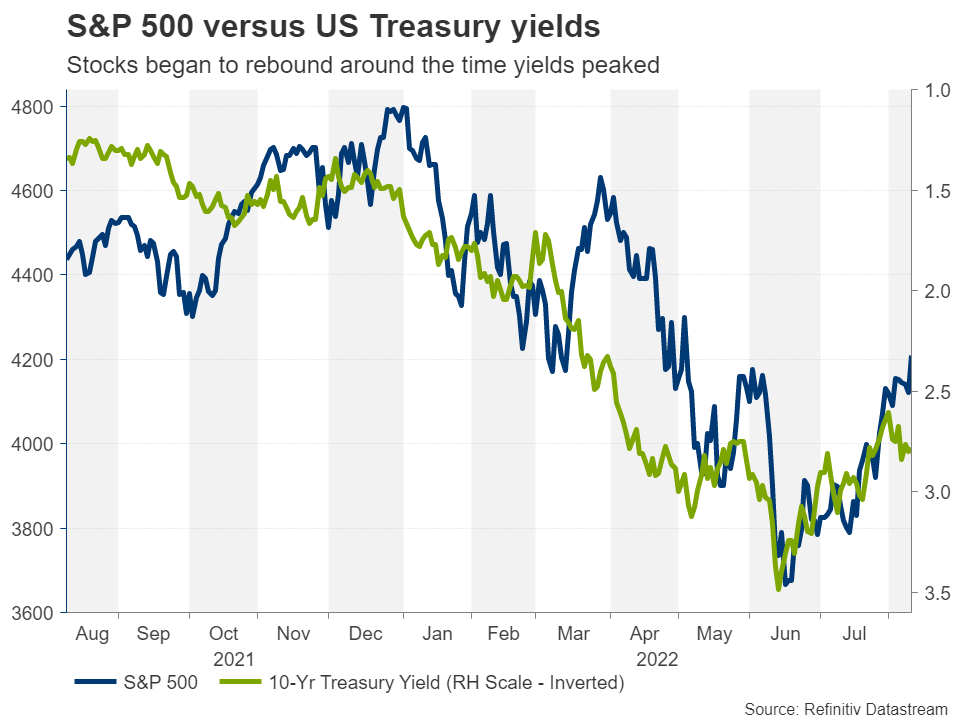
Expectations that the Federal Reserve will have to raise interest rates very aggressively to rein in soaring inflation had lifted the 10-year yield to a decade high of just under 3.5% in mid-June. But signs that not only the US economy is cooling but also that inflationary pressures have already started to recede have sparked a major pullback in global bond yields, with the 10-year yield retreating to around 2.75%.
First inflation relief in months
Inflation in the United States as measured by the consumer price index fell by more than expected in July to 8.5% y/y. More significantly, the month-on-month reductions in prices extended beyond fuel-related items, while moderating for other inflation hot spot categories such as shelter and new and used vehicles.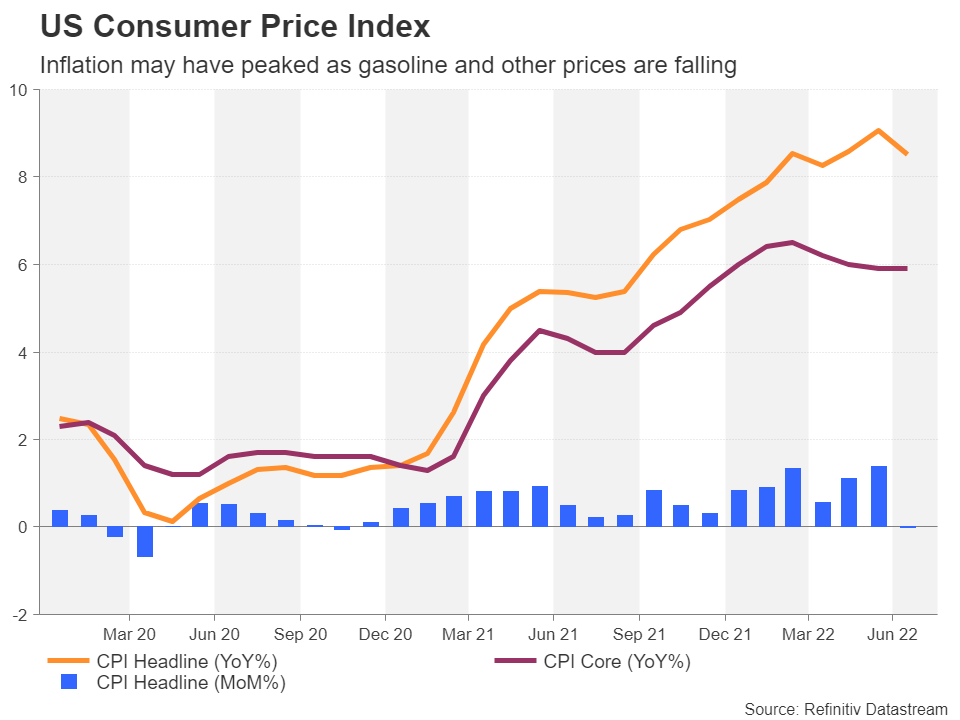
For its part, the Fed still has a lot of work to do to get inflation down towards its 2% target, and policymakers are wary about letting their guards down in their resolve to achieving this, but all the evidence points to the US now being past peak inflation. Of course, inflation is only one of the headaches investors have to grapple with and even if prices have levelled off, a lot can still go wrong. For example, the Fed may yet fail to engineer a soft landing for the economy, further energy shocks cannot be ruled out as long as the West and Russia remain at a standoff and China’s debt bomb could implode amid a deepening property crisis.
But for now, there are enough glimmers of hope to encourage investors to take more risk. Oil prices are down about 30% from the post-Ukraine war spike and other commodity prices have fallen sharply too, the global supply shortages have started to ease somewhat, and the Fed and other central banks probably won’t have to hike interest rates as high as initially dreaded.
Recession vs inflation
What is most striking in all this is that inflation fears seem to supersede recession ones. Markets can live with the strong possibility of a recession as long as yields are declining and rate cuts are priced in on the horizon, but they can’t tolerate an environment where the Fed terminal rate is being continuously revised up.
Thus, if inflation in America has indeed peaked, then the S&P 500 has likely bottomed too. From a purely technical perspective, this rebound is also looking very promising and appears to have more legs than the relief rally in March. There are several indicators that support this.
S&P 500’s technical picture is improving
First and foremost, the MACD is finally recovering from its worst rout in the history of the S&P 500 in the weekly timeframe. It hit a record low point at the beginning of July, surpassing the troughs of both the 2008-09 financial crisis as well as the Coronavirus crisis in 2020. But it has now crossed above its signal line for the first time since November 2021.
The RSI is also hinting at a trend reversal, breaking above an eight-month old descending trendline and climbing above its 50 neutral mark. Moreover, the benchmark index has cracked the ceiling of the 100-weekly moving average (MA) and is headed for the 50-weekly MA just below 4,350.
Reclaiming the 50-weekly MA would go a substantial way in negating the bearish structure. As things stand technically, there doesn’t seem to be a lot that can stand in the bulls’ path. Although in the near term, there is a growing risk of a downside correction, especially as the price action is now in the vicinity of the 4,200 level, which happens to correspond with the 50% Fibonacci retracement of the January-June downtrend.
Is the bear market really over?
But in the bigger picture, if there is one thing to be wary about this trend reversal, it is the fact that the June trough was above the 200-weekly MA. This might suggest that there could be more bumps along the road before it can be said that the S&P 500 has definitely bottomed and a bounce off the 200-weekly MA would provide a more reassuring signal that the bearish run is over. The 50% Fibonacci retracement of the post-pandemic rally slightly above the 3,500 level also feels like a more natural turning point for the index
.Ultimately, though, whether the S&P 500 can sustain this uptrend boils down to what happens to inflation and how the Fed responds. Barring any further surges in energy prices from any escalation of the Russia-Ukraine conflict, or a flare-up of tensions between the US and China, the worst is probably over for investors and inflation may well be on the way down
.Traders may have to revisit the high valuations dilemma
However, even in the best-case scenario, there is a risk that the road to recovery will be a long one as it may be a while before the Fed makes its first dovish pivot. In addition, corporate earnings are unlikely to return to the same growth levels enjoyed during the past two years anytime soon as, even with inflation simmering down, there may still be a recession in the US and Europe that could weigh on consumer demand and in turn, profitability.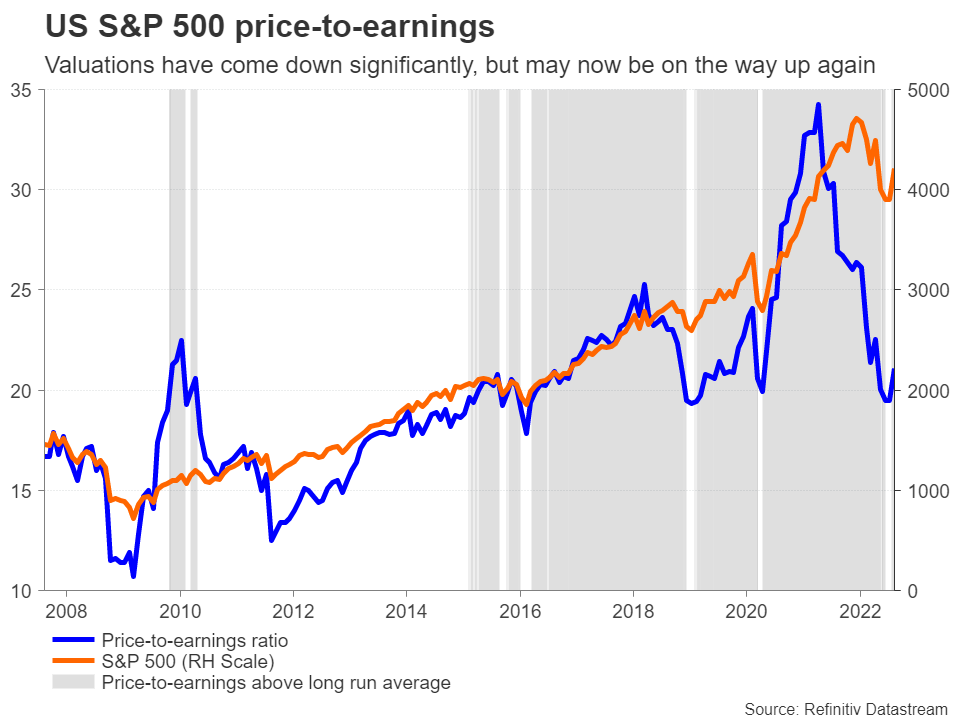
Finally, it’s easy to forget how Wall Street managed to scale the heights that it did in the post-pandemic world. Now that the excess liquidity is slowly being drained from the financial system and the era of rock-bottom borrowing costs is well and truly over, there’s a danger that buyers will think twice as soon as valuations hit exorbitant levels again, casting doubt on the prospects of the S&P 500 beating its all-time high of 4,818.62 in the foreseeable future.