
- SPX Monitoring purposes; Sold 5/24/22 at 3941.65= gain 1.033%; Long SPX on 5/20/22 at 3901.36.
- Monitoring purposes GOLD: Long GDX (NYSE:GDX) on 10/9/20 at 40.78.
- Long Term SPX monitor purposes; Neutral
We updated this chart form yesterday, when we said:
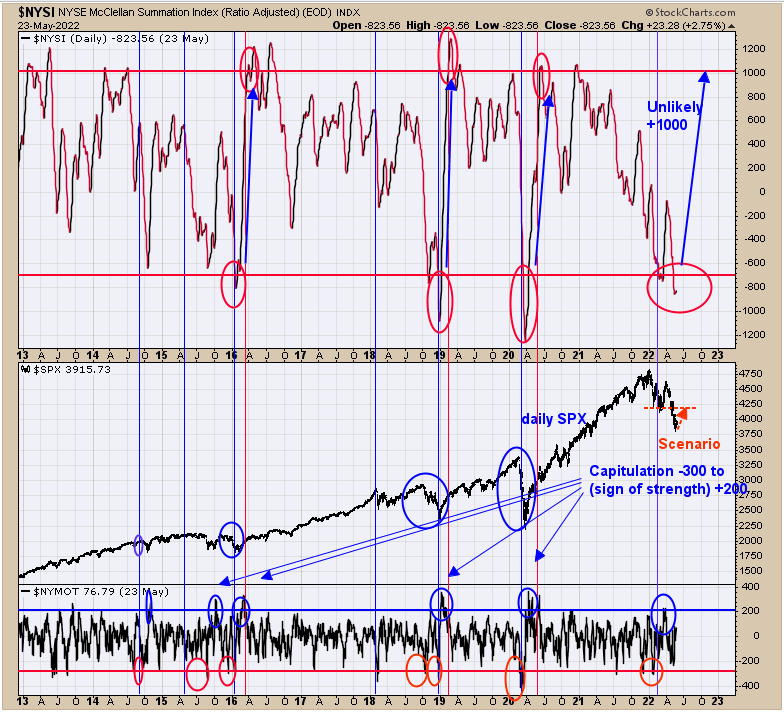
“Bullish intermediate term setups occur for the market when the NYSE McClellan Summation index falls below -700 (current reading -846) then rallies to +1000 in around two months. Back in March the Summation index fell below -700, but didn’t get above +0 on the next rally. Again Summation index is below -700 and our first target is near 4100 which is the previous high of last week. If indeed that resistance does hold, its very unlikely the Summation index will reach +1000. If Summation index fails to get to +1000 then another decline will be expected that may hit new lows.”
The summation did turn up yesterday but has not shown any strength so far, which is bearish.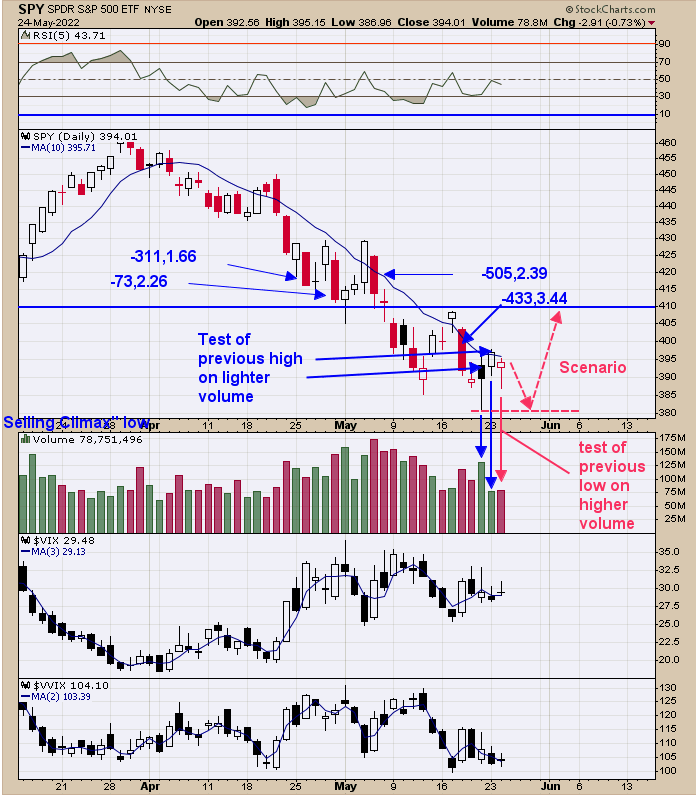
The market should see strength off a low to confirm a reversal. Yesterday’s rally off Friday’s low traded above Friday’s high but closed below the high, and volume came in near half of Friday’s volume, which is a bearish sign. We were hoping today we would see a “Sign of Strength” to confirm the reversal; instead, the market gapped down and traded below Monday’s low on higher volume, suggesting SPDR S&P 500 (NYSE:SPY) may attempt to test Friday’s low. Both VVIX and VIX were up today, suggesting a short-term pullback is possible. Our scenario is that SPY (SPX) may test Friday’s low, and if the volume is lighter on the test and Panic is present on the TRIN and Tick, a bullish setup is possible. Sold long SPX today for a gain of 1.033%.
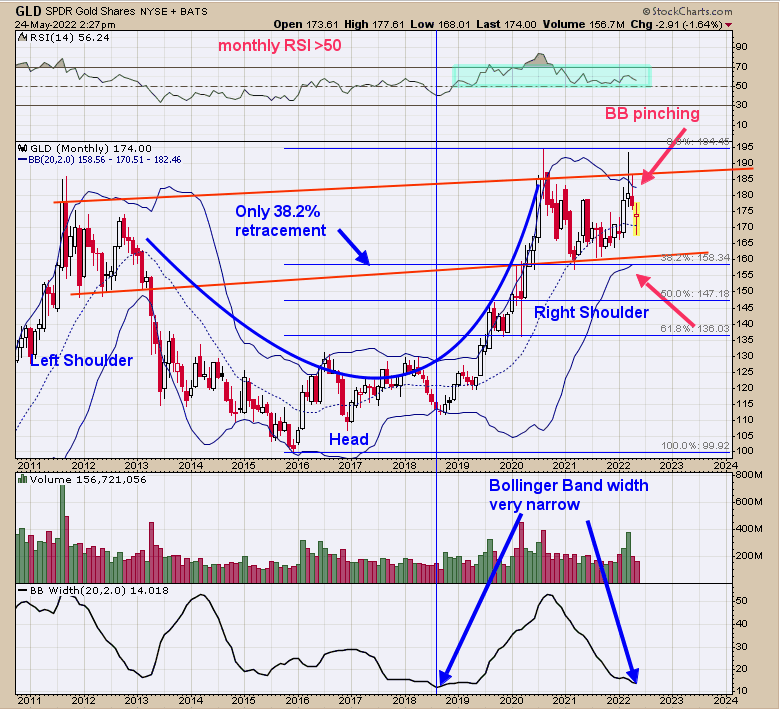
Above is the monthly chart for SPDR Gold Shares (NYSE:GLD) (ETF for gold). The monthly RSI remains above 50, suggesting the longer-term trend is up for GLD. The pattern forming appears to be a Head and Shoulders bottom, and the Right shoulder is forming now. The bottom window is the Bollinger bandwidth, which is very low, matching near the time back in mid-2018 when GLD started a strong rally that lasted nearly two years. So far, GLD has only retraced 38.2% of its rally that began back in 2016 suggests this sideways consolidation is at the halfway point of the move up, giving a target near 250. With the monthly Bollinger bands pinching, a large move is nearing.